Unlock a world of possibilities! Login now and discover the exclusive benefits awaiting you.
- Qlik Community
- :
- All Forums
- :
- QlikView Integrations
- :
- Re: Google Maps - Cluster
- Subscribe to RSS Feed
- Mark Topic as New
- Mark Topic as Read
- Float this Topic for Current User
- Bookmark
- Subscribe
- Mute
- Printer Friendly Page
- Mark as New
- Bookmark
- Subscribe
- Mute
- Subscribe to RSS Feed
- Permalink
- Report Inappropriate Content
Google Maps - Cluster
Google Maps Extension with Cluster support.
QlikTech takes no responsibility for any code and QlikTech Support Agreement does not cover issues with this extension.
Please review Googles license agreement before you put this into production.
Introduction
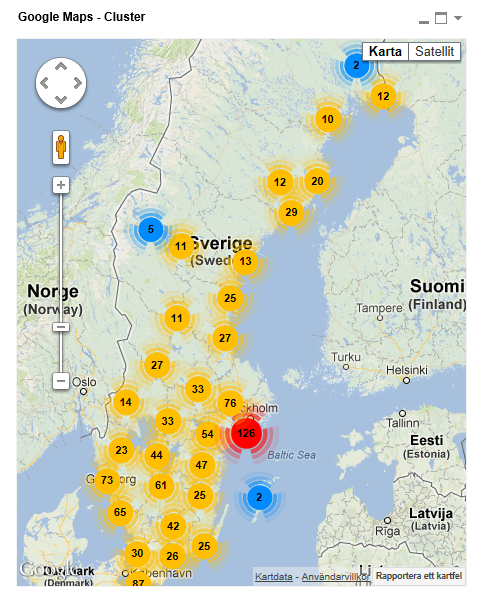
This is a QlikView extension object that integrates Google Maps Javascript API V3 and a third party library called MarkerClusterPlus into QlikView.
Load a set a coordinates into QlikView and visualize them together with this extension. The clustering feature is create when you have alot of data points and needs to group/cluster them together for greater visability and performance.
The maxzoom property defines at what zoom level you want your markers clustered. The grid size property controls how big or small cluster grid size you want.
You can either use the extension 'as is' or use it as a base to further customize it to fit your needs.
Download the extension and view source code at: https://github.com/mindspank/GoogleMaps-Cluster-QV11
If you build something awesome please share it with the community!
Live long and prosper.
2015-02-15
Removed download from post, please grab the latest version from Github instead.
2014-02-03
Various fixes.
2014-01-09
There has been numerous upgrades to the extension.
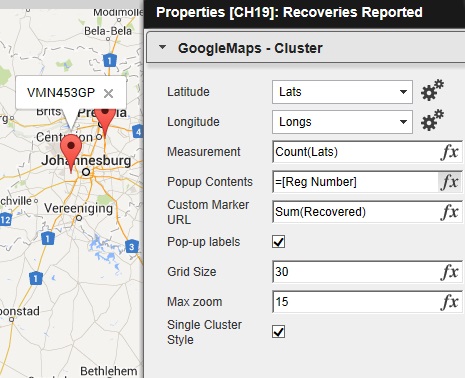
Now clusters now display the value of your expression and with added support to include more information in pop-up labels.
Example grayscale styled map included.
Possibility to show only a single cluster icon style if you do not want it to scale according to the number of markers in the cluster.
2013-06-17
Added custom marker support. Now you can specify a url for an custom marker. Accepts all major image file types.
- Mark as New
- Bookmark
- Subscribe
- Mute
- Subscribe to RSS Feed
- Permalink
- Report Inappropriate Content
Hi Alessandro
I haven't been able to get your map working yet at my customer - please could you advise me? I have installed the qar successfullly in the ProgramData folder as you advised before. It works fine in the desktop on the QV server, perfect! However my users see nothing in the browser on the server (tried IE 8 and firefox), nor in the client software on a desktop, nor a browser on the desktop. It look great in the server software and we'd really liek to use it.
In the broswer when I add new sheet object, I see no extensions in the list which suggest they're not installed pok. But I have them in the right folder and when I double clicked (with QV shut) to run them, I get the message saying all ok. also if they were'nt installed ok, the extension wouldn't work in the qv server desktop.
Any suggestions would be great, thanks very much, charlotte
- Mark as New
- Bookmark
- Subscribe
- Mute
- Subscribe to RSS Feed
- Permalink
- Report Inappropriate Content
Hi andrew
Just wondering if you have any further tips on this; I still didn't get the map working in the browser (but it's ok in the server desktop) I think you're on the right lines re the browser and adding extension objects. As when I try to add a new sheet object in the browser I have no extension objects in my list. But the .qar file is in the right ProgramData folder, and I got a message saying all installed ok, when I ran it.
Any suggestions would be most appreciated. Thanks very much, Charlotte
- Mark as New
- Bookmark
- Subscribe
- Mute
- Subscribe to RSS Feed
- Permalink
- Report Inappropriate Content
Hi Alex
I am struggling with the popup side. I want to show more detail but not sure on how to do that, I am new to all this and figuring most of this out on my own. The fields that I want to show in the pop up is: Reg Number, Make and Model. I do not know how to wright the expression.
Thanks.
- Mark as New
- Bookmark
- Subscribe
- Mute
- Subscribe to RSS Feed
- Permalink
- Report Inappropriate Content
How can we build multi selection support ? ?
- Mark as New
- Bookmark
- Subscribe
- Mute
- Subscribe to RSS Feed
- Permalink
- Report Inappropriate Content
Easiest would be to draw a polygon on the map. Get the markers within that polygon and select those lat/long values in your data model through the QV Javascript API. It's not to bad, maybe 20-30 lines of code.
Kind Regards
Alexander Karlsson
- Mark as New
- Bookmark
- Subscribe
- Mute
- Subscribe to RSS Feed
- Permalink
- Report Inappropriate Content
Could you please send an example file when you will be available ?
It is so useful solution but it has not had multi selection in default 
With many thanks.
Regards,
Murat
- Mark as New
- Bookmark
- Subscribe
- Mute
- Subscribe to RSS Feed
- Permalink
- Report Inappropriate Content
I'm farily certain someone posted a example with multi selection support previous in this thread.
The reason I have been reluctant to include it is since we currently have a bug in the JS Api which causes the Back function to not function correctly.
For example, you would select 100 markers and 100 lat/long pair would be selected in the data model. But if you would hit Back in the QV toolbar it would only step 1 selection back. So you would have to hit Back 100 times before you are back to your starting point.
- Mark as New
- Bookmark
- Subscribe
- Mute
- Subscribe to RSS Feed
- Permalink
- Report Inappropriate Content
Hello Alexander,
Is there a way to change the cluster icon based on condition, like if the total value of a cluster is more than a Million, cluster color should be Red, else your default color(Yellow).
Thanks,
Remya.
- Mark as New
- Bookmark
- Subscribe
- Mute
- Subscribe to RSS Feed
- Permalink
- Report Inappropriate Content
Hi All
My employer is worried about the license and legal stuff around using the Google maps, is there away of using open source maps with this extension?
Thanks.
- Mark as New
- Bookmark
- Subscribe
- Mute
- Subscribe to RSS Feed
- Permalink
- Report Inappropriate Content
No, it's all heavily dependent on Google Maps.
You could however build the same functionality with openstreetmap and leaflet.
Kind Regards
Alexander Karlsson