Unlock a world of possibilities! Login now and discover the exclusive benefits awaiting you.
- Qlik Community
- :
- All Forums
- :
- QlikView Integrations
- :
- Using Highcharts.js in qlikview Extensions Objects
- Subscribe to RSS Feed
- Mark Topic as New
- Mark Topic as Read
- Float this Topic for Current User
- Bookmark
- Subscribe
- Mute
- Printer Friendly Page
- Mark as New
- Bookmark
- Subscribe
- Mute
- Subscribe to RSS Feed
- Permalink
- Report Inappropriate Content
Using Highcharts.js in qlikview Extensions Objects
Hi Everyone,
I am trying to create a qlikview extension objects using highcharts.js
this is the charts i want to create
http://www.highcharts.com/demo/pie-basic
Code for creating this chart in browser is here
I am trying to write this code for extension object my script.js file is here
var path  = Qva.Remote + (Qva.Remote.indexOf('?') >= 0 ? '&' : '?') + 'public=only' + '&name=' + "Extensions/ET-HelloWorld/";
//alert('hi');
function pie_label_init(){
  Qva.LoadScript(path + 'jquery-1.11.1.min.js', function() {
  Qva.LoadScript(path + 'highcharts.js', function() {
  Qva.LoadScript(path + 'exporting.js', bar_chart)
  });
  });
  }
function bar_chart() {

    //alert('hi');
        var divhtml = document.createElement("div");
        divhtml.setAttribute('id', 'container');
    //alert('div Element created with' + divhtml.id);
    $(document).ready(function () {
    Qv.AddExtension('ET-HelloWorld', function() {
    $('#container').highcharts({
        title: {
            text: 'Monthly Average Temperature',
            x: -20 //center
        },
        subtitle: {
            text: 'Source: WorldClimate.com',
            x: -20
        },
        xAxis: {
            categories: ['Jan', 'Feb', 'Mar', 'Apr', 'May', 'Jun',
                'Jul', 'Aug', 'Sep', 'Oct', 'Nov', 'Dec']
        },
        yAxis: {
            title: {
                text: 'Temperature (°C)'
            },
            plotLines: [{
                value: 0,
                width: 1,
                color: '#808080'
            }]
        },
        tooltip: {
            valueSuffix: '°C'
        },
        legend: {
            layout: 'vertical',
            align: 'right',
            verticalAlign: 'middle',
            borderWidth: 0
        },
        series: [{
            name: 'Tokyo',
            data: [7.0, 6.9, 9.5, 14.5, 18.2, 21.5, 25.2, 26.5, 23.3, 18.3, 13.9, 9.6]
        }, {
            name: 'New York',
            data: [-0.2, 0.8, 5.7, 11.3, 17.0, 22.0, 24.8, 24.1, 20.1, 14.1, 8.6, 2.5]
        }, {
            name: 'Berlin',
            data: [-0.9, 0.6, 3.5, 8.4, 13.5, 17.0, 18.6, 17.9, 14.3, 9.0, 3.9, 1.0]
        }, {
            name: 'London',
            data: [3.9, 4.2, 5.7, 8.5, 11.9, 15.2, 17.0, 16.6, 14.2, 10.3, 6.6, 4.8]
        }]
    });
});
//alert('hi');
});
}
pie_label_init();
This code is running without any error , it also executing all the alert statements but it's not displaying the chart.
where i am wrong ?? Please Help
Thanks in Advance
Vivek
- « Previous Replies
-
- 1
- 2
- Next Replies »
Accepted Solutions
- Mark as New
- Bookmark
- Subscribe
- Mute
- Subscribe to RSS Feed
- Permalink
- Report Inappropriate Content
Hi Vievk,
i've played recently with Highcharts pie chart. In the link below you can find code for my extension that work in qlikview
Stefan
- Mark as New
- Bookmark
- Subscribe
- Mute
- Subscribe to RSS Feed
- Permalink
- Report Inappropriate Content
Hi Vievk,
i've played recently with Highcharts pie chart. In the link below you can find code for my extension that work in qlikview
Stefan
- Mark as New
- Bookmark
- Subscribe
- Mute
- Subscribe to RSS Feed
- Permalink
- Report Inappropriate Content
Hi Stefan, Thanks for the answer. this is exactly what I was looking for. Regards, Vivek
- Mark as New
- Bookmark
- Subscribe
- Mute
- Subscribe to RSS Feed
- Permalink
- Report Inappropriate Content
I am trying to do the same thing! Thanks Stefan for the sample code! When I paste this code into the scripts.js for my extension it is throwing an error. Vievk were you able to get this to work?
I am getting the generic error "Unable to get property 'prototype' of undefined or null reference". I have a feeling this is because the High Chart libraries are not loading for some reason. Any thoughts? I copied the code exactly how Stefan has it in the link he posted above.
Thanks
Bob
- Mark as New
- Bookmark
- Subscribe
- Mute
- Subscribe to RSS Feed
- Permalink
- Report Inappropriate Content
Hi Bob,
is probably because the folder of the extension. In my case the extension code is in Highcharts/Pie folder (C:\Users\UserName\AppData\Local\QlikTech\QlikView\Extensions\Objects\Highcharts\Pie).
I presume that you are not making the Highcharts folder?
Stefan
- Mark as New
- Bookmark
- Subscribe
- Mute
- Subscribe to RSS Feed
- Permalink
- Report Inappropriate Content
Hi Robert,
Please check your extension folder name and file related with that extension.It may be the reason.
I mean whatever file stefan has used it should be there . Your folder structure and folder name should also match with stefan's. Otherwise you will have to make changes into script file.
Regards,
Vivek
- Mark as New
- Bookmark
- Subscribe
- Mute
- Subscribe to RSS Feed
- Permalink
- Report Inappropriate Content
Stefan/Vivek,
Thanks for the fast responses! Yes that was the issue. The extension is no longer throwing an error, but nothing is showing in the object. This is because I am missing the jquery.min.js, highcharts.js, and exporting.js files. Where might I be able to get these files?
Again I really appreciate both of you helping!
Thanks
Bob
- Mark as New
- Bookmark
- Subscribe
- Mute
- Subscribe to RSS Feed
- Permalink
- Report Inappropriate Content
Hi Bob,
all is in the github repo
https://github.com/countnazgul/Qlikview-HighchartJS-Pie-Chart-Extension/tree/master/Highcharts/Pie
Stefan
- Mark as New
- Bookmark
- Subscribe
- Mute
- Subscribe to RSS Feed
- Permalink
- Report Inappropriate Content
Thank you both very much! This is now working.
Have a great day!
Thanks
Bob
- Mark as New
- Bookmark
- Subscribe
- Mute
- Subscribe to RSS Feed
- Permalink
- Report Inappropriate Content
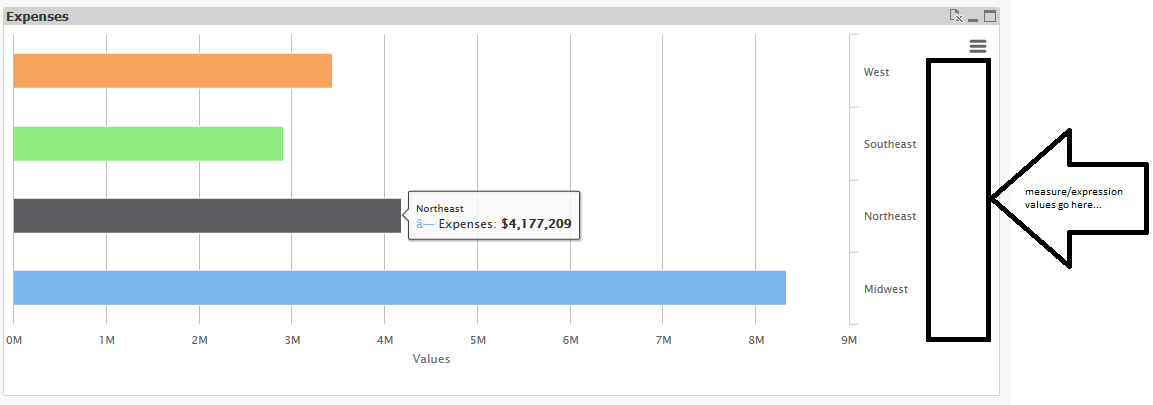
Stefan/Vivek,
Was hoping one of you might be able to help with this. I was able to change the JavaScript to create a Bar chart with the dimension labels showing on the right side of the chart. Now I am trying to show the measure/expression values next to each dimension label.
For example the screenshot below, I would like to have $4,177,209 show up to the right of Northeast.
Any suggestions would be very appreciated.
Thanks
Bob
- « Previous Replies
-
- 1
- 2
- Next Replies »