Unlock a world of possibilities! Login now and discover the exclusive benefits awaiting you.
- Qlik Community
- :
- All Forums
- :
- QlikView Integrations
- :
- Re: Visualization of Graph Data
- Subscribe to RSS Feed
- Mark Topic as New
- Mark Topic as Read
- Float this Topic for Current User
- Bookmark
- Subscribe
- Mute
- Printer Friendly Page
- Mark as New
- Bookmark
- Subscribe
- Mute
- Subscribe to RSS Feed
- Permalink
- Report Inappropriate Content
Visualization of Graph Data
Hi all,
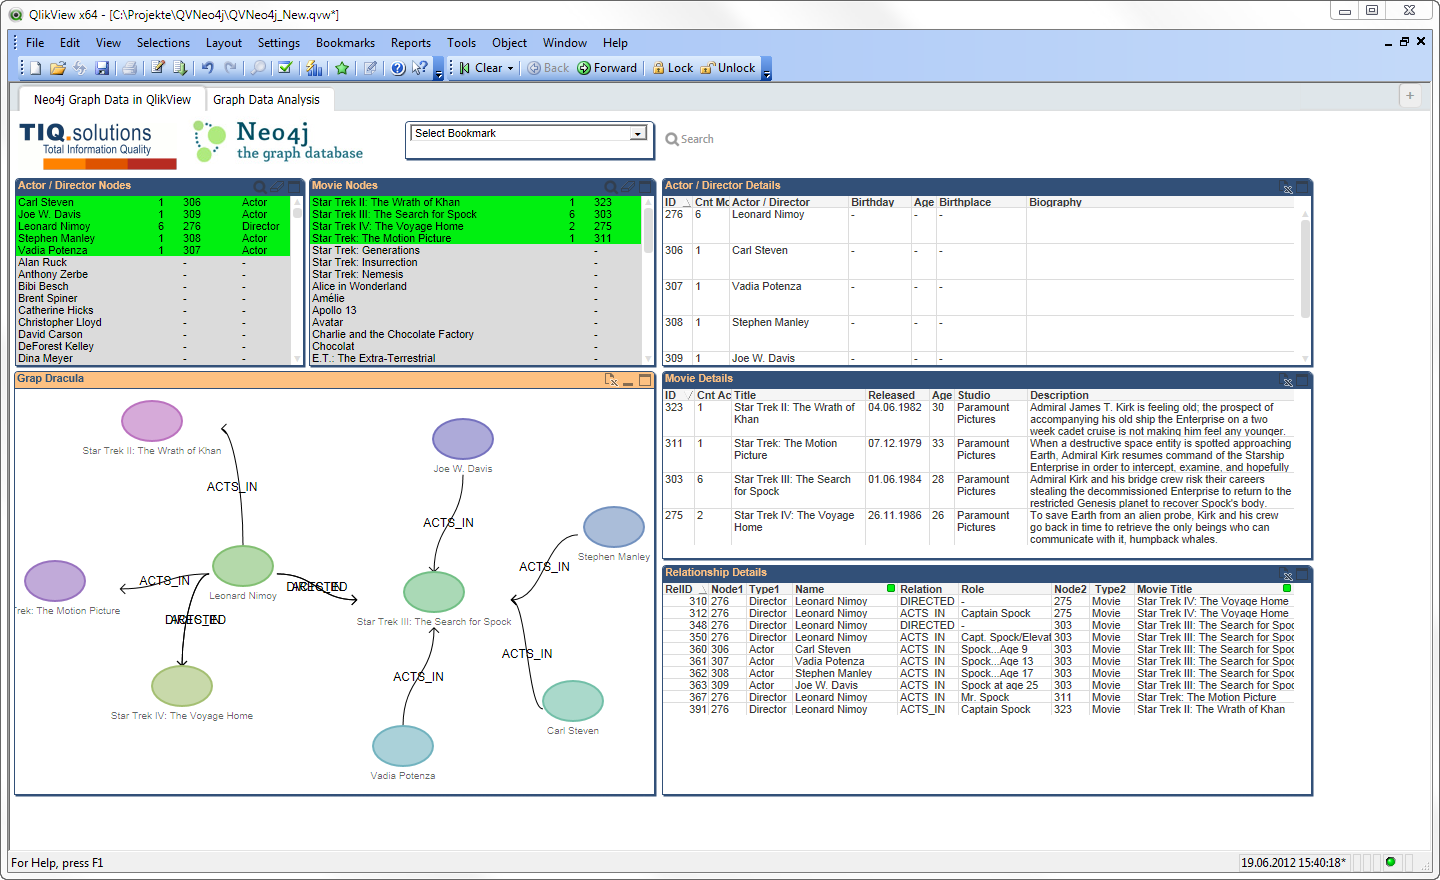
I started to develop an extension for graph visualization based on the Graph Dracula Library, using Raphael: http://www.graphdracula.net
This seems to be an interesting topic. First of all, what is the best data representation of graph data in a relational QlikView world? Second, there are a lot of limitations using those JavaScript libs. I've tried some before (D3.js etc.) but Dracula seems to have the simplest interface for my use case.
What is your opinion?
- Ralf
- « Previous Replies
- Next Replies »
- Mark as New
- Bookmark
- Subscribe
- Mute
- Subscribe to RSS Feed
- Permalink
- Report Inappropriate Content
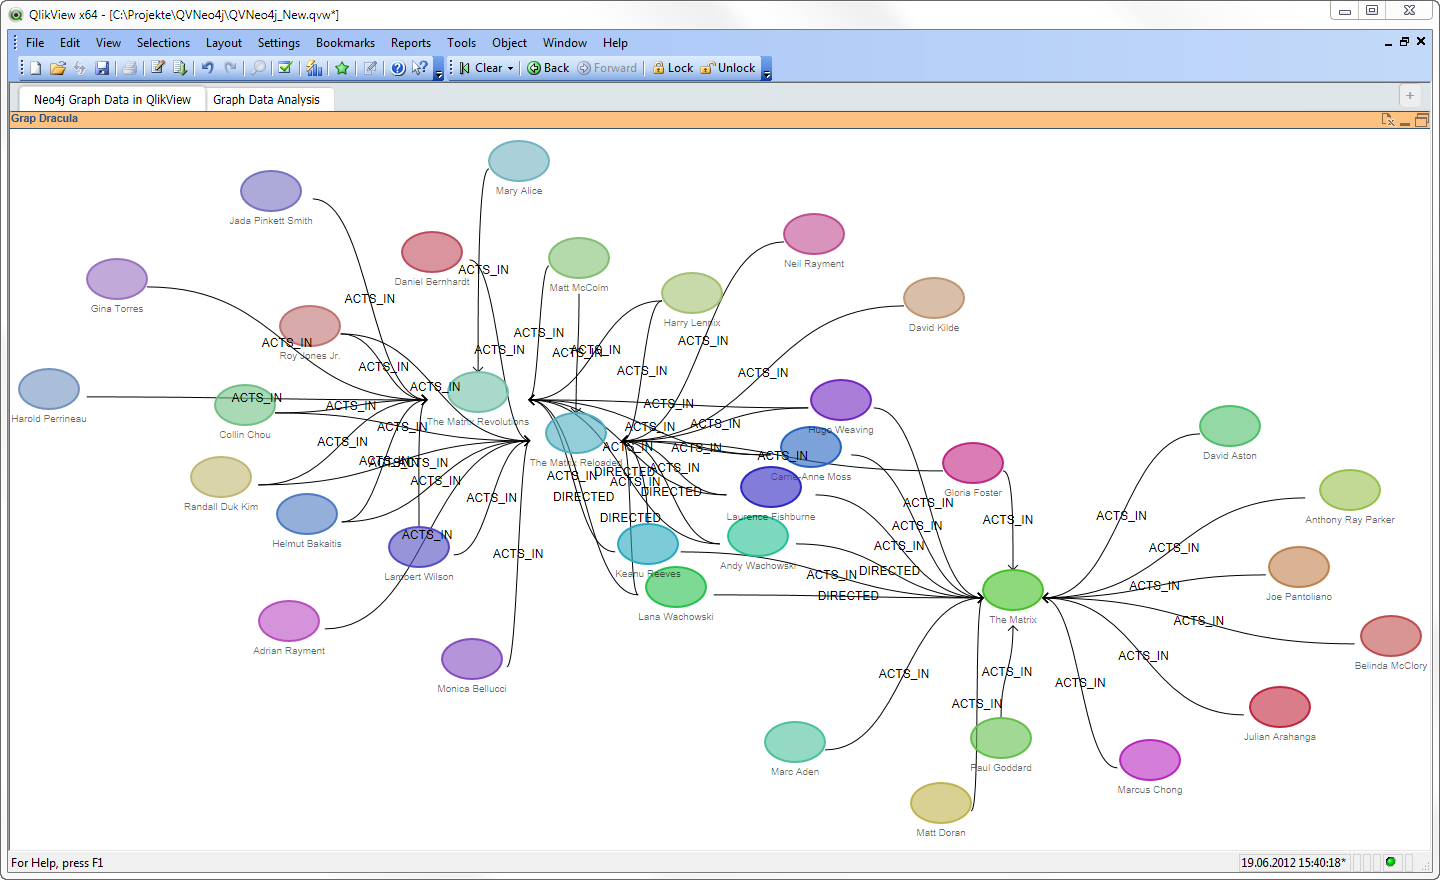
Hi @rbecher and all, how can I change the graphic to show lines in different positions when it goes to same circles ?? Like in the example:

Thank you.
- Mark as New
- Bookmark
- Subscribe
- Mute
- Subscribe to RSS Feed
- Permalink
- Report Inappropriate Content
This is possible if you have the right layout implementation.

- Mark as New
- Bookmark
- Subscribe
- Mute
- Subscribe to RSS Feed
- Permalink
- Report Inappropriate Content
Thank you for your reply.
I see you are using qliksense. Im trying to do this with your extension based on the Graph Dracula Library.
- Mark as New
- Bookmark
- Subscribe
- Mute
- Subscribe to RSS Feed
- Permalink
- Report Inappropriate Content
Yep, it’s open source so go and build..
- Mark as New
- Bookmark
- Subscribe
- Mute
- Subscribe to RSS Feed
- Permalink
- Report Inappropriate Content
Hi @rbecher .
Could you tell me what am i doing wrong?
I'm trying to define relation label color in an expression.
In Definition.xml Im doing:
<Dimension Label="Parentnode" Initial="Parent" TargetName="Dimension Name"  Width="700px" />
	<Dimension Label="Childnode" Initial="Child" TargetName="Dimension Name"  Width="600px" />
  <Measurement Label="Parent Label" Initial="Parent_Label"/>
  <Measurement Label="Child Label" Initial="Child_Label"/>
  <Measurement Label="Relation Label" Initial=""/>
  <Measurement Label="Parent Size" Initial=""/>
  <Measurement Label="Child Size" Initial=""/>
  <Measurement Label="Parent Color" Initial=""/>
  <Measurement Label="Child Color" Initial=""/>
  <Measurement Label="Edge Color" Initial=""/>
  <Measurement Label="Parent Tooltip" Initial=""/>
  <Measurement Label="Child Tooltip" Initial=""/>
  <Measurement Label="Relation Color" Initial=""/>


  <Initiate Name="Caption.Text" Value="Graph Dracula v2"/>
  <Initiate Name="Chart.Expression.0.0.Definition" Value="" />
  <Initiate Name="Chart.Expression.1.0.Definition" Value="" />
  <Initiate Name="Chart.Expression.2.0.Definition" Value="" />
  <Initiate Name="Chart.Expression.3.0.Definition" Value="10" />
  <Initiate Name="Chart.Expression.4.0.Definition" Value="10" />
  <Initiate Name="Chart.Expression.5.0.Definition" Value="color(1)" />
  <Initiate Name="Chart.Expression.6.0.Definition" Value="color(2)" />
  <Initiate Name="Chart.Expression.7.0.Definition" Value="rgb(200,200,200)" />
  <Initiate Name="Chart.Expression.8.0.Definition" Value="'Tooltip'" />
  <Initiate Name="Chart.Expression.9.0.Definition" Value="'Tooltip'" />
  <Initiate Name="Chart.Expression.10.0.Definition" Value="rgb(200,200,200)" />
In script.js:
 var parentLabel = _this.Data.HeaderRows[0][2].text || false,
                    childLabel = _this.Data.HeaderRows[0][3].text || false,
                    relLabel = _this.Data.HeaderRows[0][4].text || false,
                    parentSize = _this.Data.HeaderRows[0][5].text || false,
                    childSize = _this.Data.HeaderRows[0][6].text || false,
                    parentColor = _this.Data.HeaderRows[0][7].text || false,
                    childColor = _this.Data.HeaderRows[0][8].text || false,
                    edgeColor = _this.Data.HeaderRows[0][9].text || false,
                    parentTooltip = _this.Data.HeaderRows[0][10].text || false,
                    childTooltip = _this.Data.HeaderRows[0][11].text || false
					relcolor = _this.Data.HeaderRows[0][12].text || false
                ;
				.
				.
				.
				.
				 if ((row[0].value || false) && (row[1].value || false)) {
                        g.addEdge(row[0].text, row[1].text, {
                            directed: true,
                            label: relLabel ? row[4].text.replace("\\n", "\n") : '',
                            //callback: function (edge) { if (edge.label || false) edge.toBack();},
                            "stroke": edgeColor ? row[9].text : '#aaaaaa',
                            "label-style": { "font-size": 8, "fill": (relcolor) ? row[12].text : '#aaaaaa'}

                        });

                    }
But Im getting a blank graphic.
Thank you.
- Mark as New
- Bookmark
- Subscribe
- Mute
- Subscribe to RSS Feed
- Permalink
- Report Inappropriate Content
Changeing the dracula_graffle.js I could handle two edge labels without overlapping.
 /* setting label */
		 if(x4<=x3) {
		  style && style.label
			  && (edge.label && edge.label.attr({x:(x1+x4)/2+15, y:(y1+y4)/2-15})
				  || (edge.label = selfRef.text((x1+x4)/2+15, (y1+y4)/2-15, style.label)
					.attr({fill: "#000", "font-size": style["font-size"] || "12px"})));
		  style && style.label && style["label-style"] && edge.label
			&& edge.label.attr(style["label-style"]);
		  style && style.callback && style.callback(edge);
		}  else{
			style && style.label
			  && (edge.label && edge.label.attr({x:(x1+x4)/2-15, y:(y1+y4)/2+15})
				  || (edge.label = selfRef.text((x1+x4)/2-15, (y1+y4)/2+15, style.label)
					.attr({fill: "#000", "font-size": style["font-size"] || "12px"})));
		  style && style.label && style["label-style"] && edge.label
			&& edge.label.attr(style["label-style"]);
		  style && style.callback && style.callback(edge);
		}

- Mark as New
- Bookmark
- Subscribe
- Mute
- Subscribe to RSS Feed
- Permalink
- Report Inappropriate Content
How can I put a break line when parent/child labels are too long?
- Mark as New
- Bookmark
- Subscribe
- Mute
- Subscribe to RSS Feed
- Permalink
- Report Inappropriate Content
HI @rbecher
Hope you are well.
Could you please suggest if this works in Qlik sense version May2023 (patch 13) or above ?
Many Thanks
Ani
- Mark as New
- Bookmark
- Subscribe
- Mute
- Subscribe to RSS Feed
- Permalink
- Report Inappropriate Content
This is/was a QlikView extension and not compatible with any version of Qlik Sense.
If you need to visualize a network of nodes in Qlik Sense, then maybe the visualization bundled Network chart can be interesting to have a look at.
Qlik Community MVP
- « Previous Replies
- Next Replies »