Unlock a world of possibilities! Login now and discover the exclusive benefits awaiting you.
- Qlik Community
- :
- All Forums
- :
- QlikView
- :
- Timestampconversion: Timestamp format with millise...
- Subscribe to RSS Feed
- Mark Topic as New
- Mark Topic as Read
- Float this Topic for Current User
- Bookmark
- Subscribe
- Mute
- Printer Friendly Page
- Mark as New
- Bookmark
- Subscribe
- Mute
- Subscribe to RSS Feed
- Permalink
- Report Inappropriate Content
Timestampconversion: Timestamp format with milliseconds in chart
Hello community,
I got the date and Time with the following two format:
Sep 15 2015 10:23:10.345.678
15.09.2015 10:23:10.345.678
the timestamp is in an xml-file which I want to import.
I want to create a graph with the complete timestamp on x-axis. The data is from more than one day. Because of this I need the date an the time with the milliseconds.
I have no ideas how i can do this. I have already tried several ways, but i doesn't work.
I got no numerical Values on x-axis in the chart.
Accepted Solutions
- Mark as New
- Bookmark
- Subscribe
- Mute
- Subscribe to RSS Feed
- Permalink
- Report Inappropriate Content
Hi,
one solution could be:
tabTimestamps:
LOAD *,
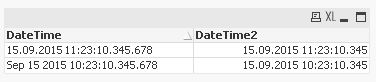
Timestamp(Alt(Timestamp#(Left(DateTime,Len(DateTime)-4),'DD.MM.YYYY hh:mm:ss.fff'),Timestamp#(Left(DateTime,Len(DateTime)-4),'MMM DD YYYY hh:mm:ss.fff')),'DD.MM.YYYY hh:mm:ss.fff') as DateTime2
INLINE [
DateTime
Sep 15 2015 10:23:10.345.678
15.09.2015 11:23:10.345.678
];
hope this helps
regards
Marco
- Mark as New
- Bookmark
- Subscribe
- Mute
- Subscribe to RSS Feed
- Permalink
- Report Inappropriate Content
What are the last six digits denote? For milliseconds, only three digits would be needed, right?
In general, you need to read your field values in so that QV interpretes them as timestamps:
- Mark as New
- Bookmark
- Subscribe
- Mute
- Subscribe to RSS Feed
- Permalink
- Report Inappropriate Content
There are two different Timestamps in the xml-files:
<Time>15.09.2015 10:23:10.345.678</Time>
<Time>Sep 15 2015 10:23:10.345.678</Time>
the last six digits are because of the simulation-software. hh:mm:ss.milliseconds.microseconds.
Maybe it is easier to cut the microseconds but I have no idea.
There is another problem to solve. I get a start time of simulation
<Start>Tue Sep 15 10:23:01</Start>
and for each simulationstep a timestamp
<Stamp>00:00:09.345.678</Stamp>
the result for each simulationstep for the plot in qlikview should look like this
15.09.2015 10:23:10.345.678
i have tried serveral things with set and timestamp#, date#.....
SET DateFormat='DD.MM.YYYY';
//SET TimestampFormat='DD.MM.YYYY hh:mm:ss[.fff]';
SET TimestampFormat='DD.MM.YYYY hh:mm:ss.fff.fff';
TTT:
LOAD
timestamp#(Time, 'MMM dd YYYY hh:mm:ss.fff.fff) as Time
timestamp#(Start, 'ddd MMM YY hh:mm:ss') as StartTime
Stamp
FROM
and tried to change the settings of the diagramm but i didn't get it.
- Mark as New
- Bookmark
- Subscribe
- Mute
- Subscribe to RSS Feed
- Permalink
- Report Inappropriate Content
could you post the test.xml file?
- Mark as New
- Bookmark
- Subscribe
- Mute
- Subscribe to RSS Feed
- Permalink
- Report Inappropriate Content
Hi,
one solution could be:
tabTimestamps:
LOAD *,
    Timestamp(Alt(Timestamp#(Left(DateTime,Len(DateTime)-4),'DD.MM.YYYY hh:mm:ss.fff'),Timestamp#(Left(DateTime,Len(DateTime)-4),'MMM DD YYYY hh:mm:ss.fff')),'DD.MM.YYYY hh:mm:ss.fff') as DateTime2
INLINE [
    DateTime
    Sep 15 2015 10:23:10.345.678
    15.09.2015 11:23:10.345.678
];
hope this helps
regards
Marco
- Mark as New
- Bookmark
- Subscribe
- Mute
- Subscribe to RSS Feed
- Permalink
- Report Inappropriate Content
Hi,
now it works 
I'm able to create a chart with the timestamps. I tried several times, but I didn' get it. Thanks for your help.
a part of the xml-file is in the attachments. (Original filesize up to 10GB, because of the duration an number of events of the simulation)
What I want to do is:
- I want to import the file in Qlikview
- create an Absolute Timestamp for each event like DateTime2 15.09.2015 12:23:45.948 for charts
- create a Chart with contains the values of the different Variables vs Timestamp
- and if it is possible a dot or something else with the name of the Event, when a Event occurs
regards
Mat
- Mark as New
- Bookmark
- Subscribe
- Mute
- Subscribe to RSS Feed
- Permalink
- Report Inappropriate Content
Hi @MarcoWedel ,
Tried same code, then I saw your code it is same for my case as well, still not getting why it's not working, M I missing something?, need to calculate max from several dates.
Given format : MMM DD YYYY hh:mm:ss:fff TT
Required Format : MM-DD-YYYY hh:mm:ss
[Sheet1]:
LOAD
[Report],
[Sales],
[reportRunDate]
from excel;
Res:
Load
max(Timestamp(Timestamp#(reportRunDate,'MMM DD YYYY hh:mm:ss:fff TT),'MM-DD-YYYY hh:mm:ss')) as maxDate
Resident Sheet1;
Drop table Sheet1;
Regards,
Shubham