Unlock a world of possibilities! Login now and discover the exclusive benefits awaiting you.
- Qlik Community
- :
- All Forums
- :
- QlikView
- :
- 2 needle in speedometer
- Subscribe to RSS Feed
- Mark Topic as New
- Mark Topic as Read
- Float this Topic for Current User
- Bookmark
- Subscribe
- Mute
- Printer Friendly Page
- Mark as New
- Bookmark
- Subscribe
- Mute
- Subscribe to RSS Feed
- Permalink
- Report Inappropriate Content
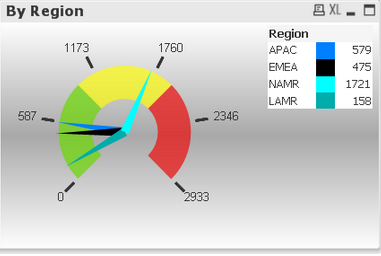
2 needle in speedometer
Is it possible in one chart (speedometer) to have 2 expressions (needles).
In the first i wanna have avg(Paymentterm)
In the second avg(Paymentdays)
- Tags:
- new_to_qlikview
Accepted Solutions
- Mark as New
- Bookmark
- Subscribe
- Mute
- Subscribe to RSS Feed
- Permalink
- Report Inappropriate Content
not in one chart but multiple gauge charts can be used in transparent mode to achieve your requirement.
see here. Multi value Gauge Charts
- Mark as New
- Bookmark
- Subscribe
- Mute
- Subscribe to RSS Feed
- Permalink
- Report Inappropriate Content
This is no possible with the integrated Chart, as the help states "Gauge charts are used to display the value of a single expression". This would be something to be solved with a Extension Object.
- Mark as New
- Bookmark
- Subscribe
- Mute
- Subscribe to RSS Feed
- Permalink
- Report Inappropriate Content
NO it is not possible may be you can use the two charts one for avg(Paymentterm) and another one for
avg(Paymentdays) and toggle it by the variables and some selection and triggered the variables for chart display.
- Mark as New
- Bookmark
- Subscribe
- Mute
- Subscribe to RSS Feed
- Permalink
- Report Inappropriate Content
not in one chart but multiple gauge charts can be used in transparent mode to achieve your requirement.
see here. Multi value Gauge Charts