Unlock a world of possibilities! Login now and discover the exclusive benefits awaiting you.

Announcements
Share your agentic AI experience, learn from others, and earn a new badge: Put Agentic AI to Work
- Qlik Community
- :
- All Forums
- :
- QlikView
- :
- AVERAGE different visualization?
Options
- Subscribe to RSS Feed
- Mark Topic as New
- Mark Topic as Read
- Float this Topic for Current User
- Bookmark
- Subscribe
- Mute
- Printer Friendly Page
Turn on suggestions
Auto-suggest helps you quickly narrow down your search results by suggesting possible matches as you type.
Showing results for

Not applicable
2013-06-05
07:52 AM
- Mark as New
- Bookmark
- Subscribe
- Mute
- Subscribe to RSS Feed
- Permalink
- Report Inappropriate Content
AVERAGE different visualization?
I currently have a barchart with the average lines over the year (See image).
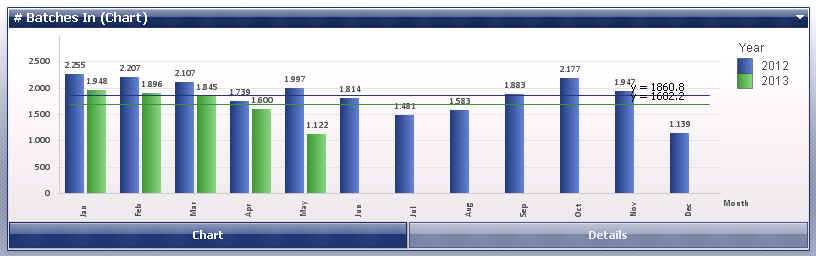
But i have some questions related to this average, I'm pretty new to qlikview.
- Is there a way to have the same colors for all averages.
- Is there another way of visualizing this average number? Like when hovering over the average line that it shows a average, a white background color with 50% trancparency or something else that makes it better readable? Now it is unreadable. Maybe even with a symbol? But I'm unable to check Symbol in my Bar Chart Expression settings.
719 Views
0 Replies