Unlock a world of possibilities! Login now and discover the exclusive benefits awaiting you.

- Qlik Community
- :
- All Forums
- :
- QlikView
- :
- Adding Average Lines to Trellis
- Subscribe to RSS Feed
- Mark Topic as New
- Mark Topic as Read
- Float this Topic for Current User
- Bookmark
- Subscribe
- Mute
- Printer Friendly Page

- Mark as New
- Bookmark
- Subscribe
- Mute
- Subscribe to RSS Feed
- Permalink
- Report Inappropriate Content
Adding Average Lines to Trellis
Hi Everyone,
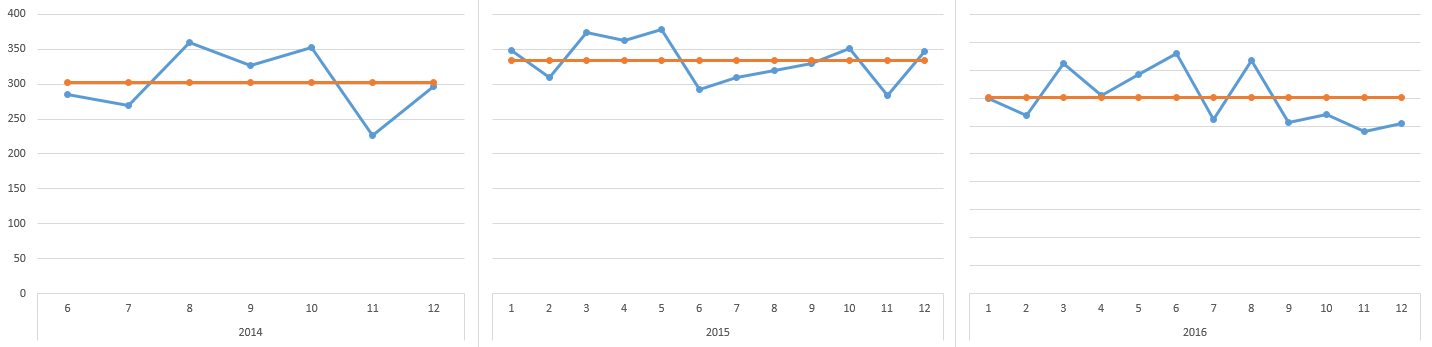
I'm creating a trellis line chart which a tracks a value year over month. I'd like to add a line indicating the average value per year to each section of the trellis chart. I've tried following this solution:
Reference lines for each section of the trellis chart
I've attached a small application as an example. I can calculate the correct yearly average, however I'm not able to extend that value to all months in the given year. I would like my chart to look like the below image.
Thanks!
Michael
- Tags:
- trellis
- Mark as New
- Bookmark
- Subscribe
- Mute
- Subscribe to RSS Feed
- Permalink
- Report Inappropriate Content
do you want to achieve 12 separate data points for 2014?
- Mark as New
- Bookmark
- Subscribe
- Mute
- Subscribe to RSS Feed
- Permalink
- Report Inappropriate Content
Yes, I believe that's what I want. As long as the average line extends across all months for each year.
- Mark as New
- Bookmark
- Subscribe
- Mute
- Subscribe to RSS Feed
- Permalink
- Report Inappropriate Content
could you add your excel file please, I think you'll have to add the missing values at script level
- Mark as New
- Bookmark
- Subscribe
- Mute
- Subscribe to RSS Feed
- Permalink
- Report Inappropriate Content
Here it is. Thanks.
- Mark as New
- Bookmark
- Subscribe
- Mute
- Subscribe to RSS Feed
- Permalink
- Report Inappropriate Content
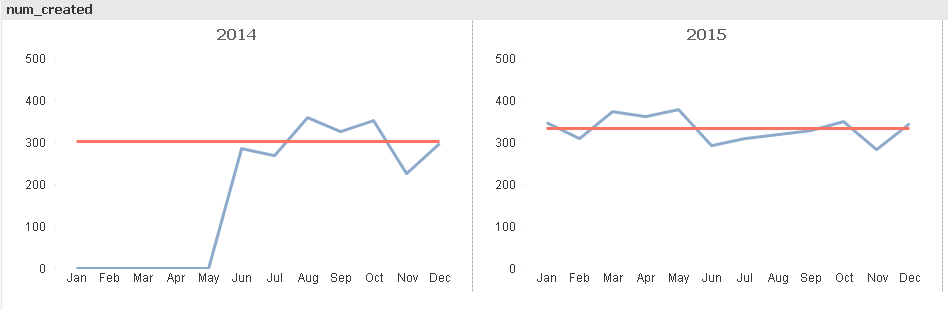
not sure, if 100% correct, but I think the basic idea should be clear ...
- Mark as New
- Bookmark
- Subscribe
- Mute
- Subscribe to RSS Feed
- Permalink
- Report Inappropriate Content
or use a separate calendar....
- Mark as New
- Bookmark
- Subscribe
- Mute
- Subscribe to RSS Feed
- Permalink
- Report Inappropriate Content
Thanks for the suggestions Robin. Is there any way to calculate the averages without changing the script? I was hoping this could be done by writing an expression.
Thanks
- Mark as New
- Bookmark
- Subscribe
- Mute
- Subscribe to RSS Feed
- Permalink
- Report Inappropriate Content
I don't think that it is possible without changing the script because the values just don't exist for 2014...
(could be that I am wrong  )
)
For this chart type there's no "populate missing" option as it exists for pivot charts.