Unlock a world of possibilities! Login now and discover the exclusive benefits awaiting you.

- Qlik Community
- :
- All Forums
- :
- QlikView
- :
- Aggregate Count by Date
- Subscribe to RSS Feed
- Mark Topic as New
- Mark Topic as Read
- Float this Topic for Current User
- Bookmark
- Subscribe
- Mute
- Printer Friendly Page

- Mark as New
- Bookmark
- Subscribe
- Mute
- Subscribe to RSS Feed
- Permalink
- Report Inappropriate Content
Aggregate Count by Date
Hi community.
I am trying to achieve a simple transformation of data to enhance visualization in a table. I can easily reproduce it in Excel but it is being really tough in QS.
The transformation is this one:
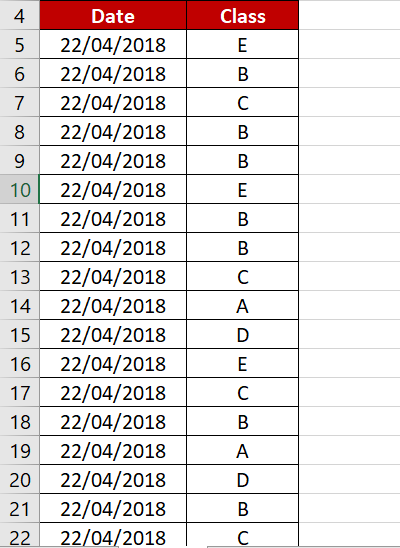
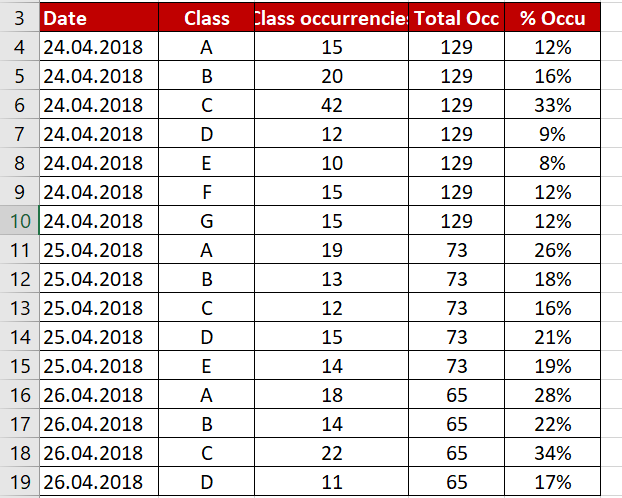
I just want to count the number of times each class appear per date, and compute the rate of occurrences per date.
I am trying to accomplish this with a Table and a Pivot Table, but with any of them I success:
In the case of the table, I am able to get the nominator and denominator by =Aggr(Count(Class), Date). But I can't compute the division as =Count(Date)/Aggr(Count(Class), Date) because I get 'INVALID DIMENSION'
In the case of the pivot table, I just receive the output for 1 class per Date, and QS is ignoring the rest of the classes.
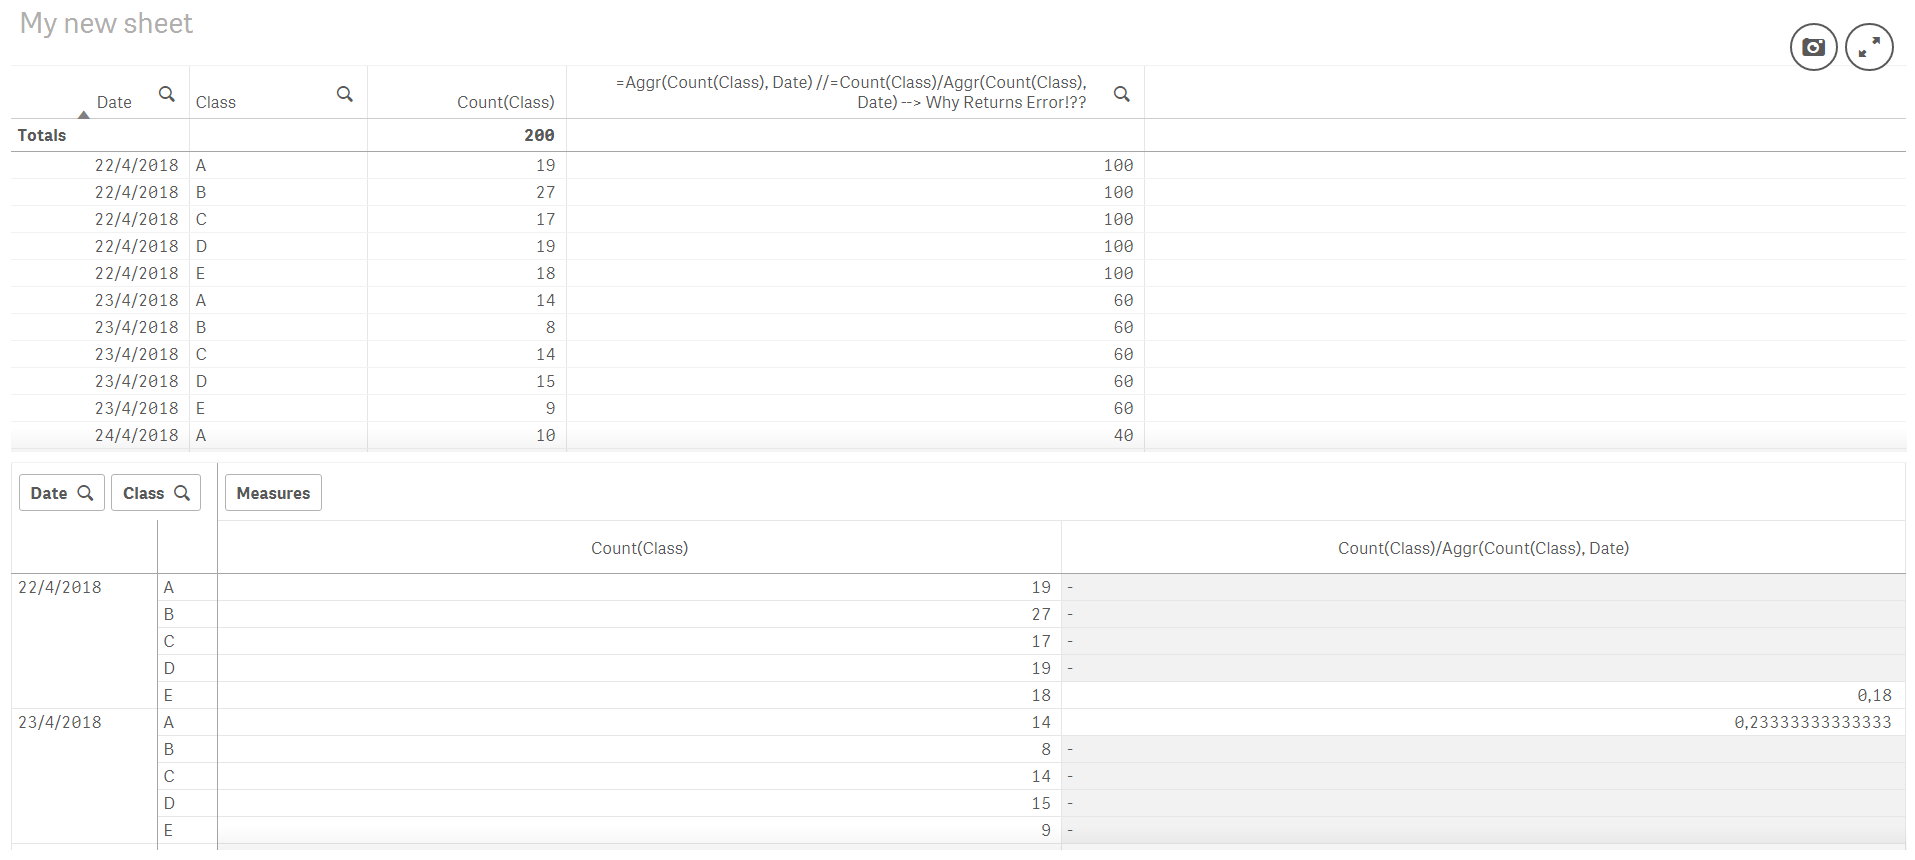
I attach the QS App in here.
Thanks in advance for the help!
Pablo

 sunny_talwar
- Mark as New
- Bookmark
- Subscribe
- Mute
- Subscribe to RSS Feed
- Permalink
- Report Inappropriate Content
Is this what you want?
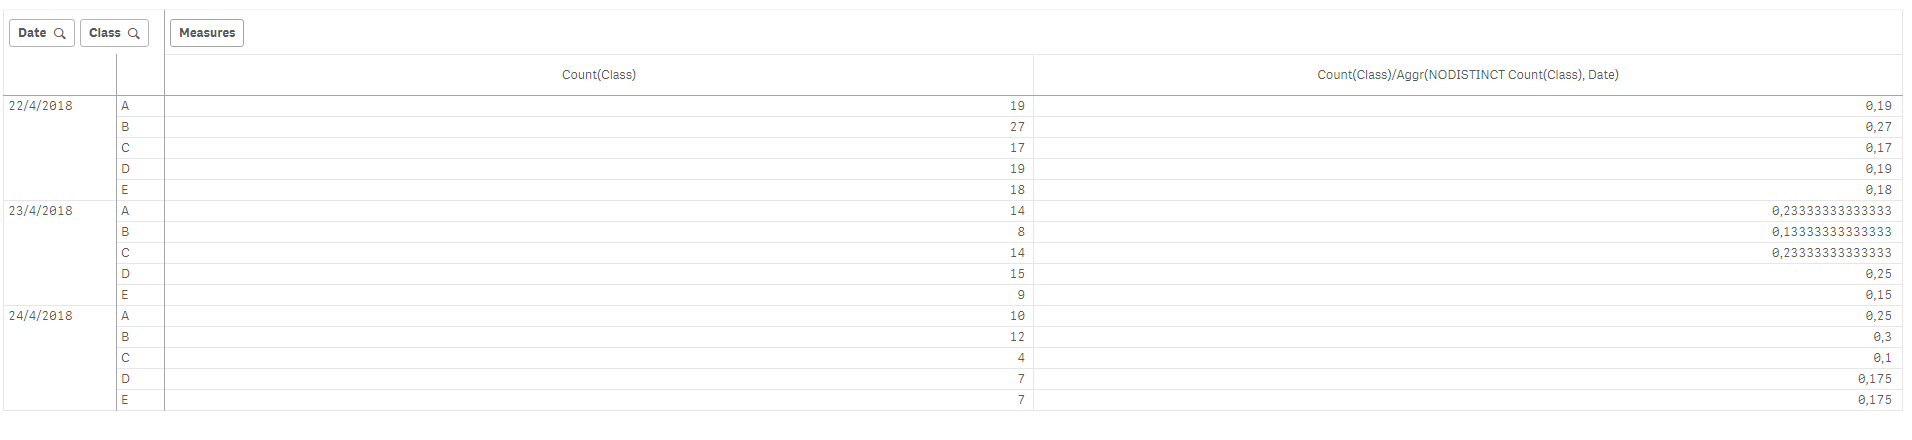
Count(Class)/Aggr(NODISTINCT Count(Class), Date)