Unlock a world of possibilities! Login now and discover the exclusive benefits awaiting you.

- Qlik Community
- :
- All Forums
- :
- QlikView
- :
- Annualized Sales for Customer & Distributors
- Subscribe to RSS Feed
- Mark Topic as New
- Mark Topic as Read
- Float this Topic for Current User
- Bookmark
- Subscribe
- Mute
- Printer Friendly Page

- Mark as New
- Bookmark
- Subscribe
- Mute
- Subscribe to RSS Feed
- Permalink
- Report Inappropriate Content
Annualized Sales for Customer & Distributors
Dear QV Experts,
Annualized Sales for Customer & Distributors:
The Expression for
Actual Sales:
=num(Sum({$<Date={">=$(CYStartDate)<=$(vMaxDate)"}>} CustomerSales)/1000,'$#,##0.00')
Annualized Sales,
Earlier we save the MaxSalesDate from the dataset in a variable & used it.
=num(( (Sum({$<Date={">=$(CYStartDate)<=$(vMaxDate)"}>} CustomerSales)/1000) / DayNumberOfYear(CYMaxCustDate))*DayNumberOfYear(CYEndDate),'$#,##0.00')
Now the requirement is that,
One Customer has multiple Distributors.
Selecting Customers in ListBox will display multiple Distubtors in Straight Table.
Each Distributor having different Max Sales Date, based on that Annualized Sales will Differ.
Please find the screenshot marked in Red.
Max, shows 65 days [ Which was the MaxSalesDate in the dataset]
MaxCustDate, shows different MaxSalesDate for the Distributors.
Here in the Expression, Selected Sum of Rows, so can Grand Total correctly. But in the KPI i can't able to sum up.
Can you please suggest me.
- Tags:
- new_to_qlikview

Accepted Solutions

 sunny_talwar
- Mark as New
- Bookmark
- Subscribe
- Mute
- Subscribe to RSS Feed
- Permalink
- Report Inappropriate Content
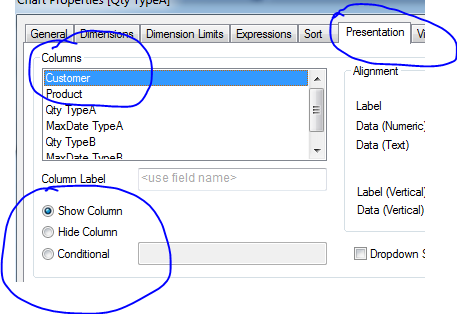
If it is straight table, why don't you keep the CustomerName table, but just hide it from anybody seeing it. This can be done on the presentation tab:
sunny_talwar
- Mark as New
- Bookmark
- Subscribe
- Mute
- Subscribe to RSS Feed
- Permalink
- Report Inappropriate Content
Use aggregate function to achieve what you are looking for. If I understood correctly you want to see 8,798.64 as a KPI, right? Try something like this:
Sum(Aggr(YourExpression4Annualized, YourChartDimensions))
- Mark as New
- Bookmark
- Subscribe
- Mute
- Subscribe to RSS Feed
- Permalink
- Report Inappropriate Content
Excellent Sunny. It works now. Great.
sunny_talwar
- Mark as New
- Bookmark
- Subscribe
- Mute
- Subscribe to RSS Feed
- Permalink
- Report Inappropriate Content
Awesome 
- Mark as New
- Bookmark
- Subscribe
- Mute
- Subscribe to RSS Feed
- Permalink
- Report Inappropriate Content
Similarly,
The straight which doesn't have Distributor but with other dimensions, Segment, Item,Brand, etc
showing Annualized Sales Incorrectly.
When i include Distributor in Dimension, then i could able to view the Annualized Sales correctly.
But the requirement is not to show the Distributor in the second chart & the Annualized should be &8,798.49 .
Can you please suggest me on this.
Please find the screenshot below.
Thanks
sunny_talwar
- Mark as New
- Bookmark
- Subscribe
- Mute
- Subscribe to RSS Feed
- Permalink
- Report Inappropriate Content
If it is straight table, why don't you keep the CustomerName table, but just hide it from anybody seeing it. This can be done on the presentation tab:
- Mark as New
- Bookmark
- Subscribe
- Mute
- Subscribe to RSS Feed
- Permalink
- Report Inappropriate Content
Thanks Sunny. It works. Awesome.