Unlock a world of possibilities! Login now and discover the exclusive benefits awaiting you.
- Qlik Community
- :
- All Forums
- :
- QlikView
- :
- Avg, Above, etc...
- Subscribe to RSS Feed
- Mark Topic as New
- Mark Topic as Read
- Float this Topic for Current User
- Bookmark
- Subscribe
- Mute
- Printer Friendly Page
- Mark as New
- Bookmark
- Subscribe
- Mute
- Subscribe to RSS Feed
- Permalink
- Report Inappropriate Content
Avg, Above, etc...
Hi,
I have data in a table as:
| id | date | units |
| 1 | 201706 | 2 |
| 2 | 201706 | 3 |
| 3 | 201706 | 4 |
| 4 | 201707 | 5 |
| 5 | 201707 | 6 |
| 6 | 201707 | 7 |
| 7 | 201707 | 8 |
| 8 | 201708 | 9 |
| 9 | 201708 | 2 |
| 10 | 201708 | 3 |
| 11 | 201708 | 4 |
| 12 | 201708 | 5 |
| 13 | 201708 | 6 |
| 14 | 201710 | 7 |
| 15 | 201710 | 8 |
| 16 | 201710 | 9 |
| 17 | 201710 | 10 |
| 18 | 201711 | 11 |
| 19 | 201711 | 12 |
| 20 | 201711 | 13 |
| 21 | 201712 | 4 |
| 22 | 201712 | 5 |
| 23 | 201712 | 6 |
I would need to develop a line graph by Date and as a measure I should calculate the average of units as follows:
- I just need data for the last four months (201711, 201710,201709, 201708). Notice that 201709 has no data but I need to show it in the graph.
- The value of the month before the current month (month n-1) will be the average of "Units" of the previous 3 months
- The value of the previous month (month n-2), will be the average of "Units" between n-4 and n-1
- The value of the previous month (month n-3), will be the average of "Units" between n-5 and n-1
- The value of the previous month (month n-4), will be the average of "Units" between n-6 and n-1
So, the following table indicates the rows included in each calculation:
| id | date | units | avg 201711 (n-1) | avg 201710 (n-2) | avg 201709 (n-3) | avg 201708 (n-4) |
| 1 | 201706 | 2 | 2 | |||
| 2 | 201706 | 3 | 3 | |||
| 3 | 201706 | 4 | 4 | |||
| 4 | 201707 | 5 | 5 | 5 | ||
| 5 | 201707 | 6 | 6 | 6 | ||
| 6 | 201707 | 7 | 7 | 7 | ||
| 7 | 201707 | 8 | 8 | 8 | ||
| 8 | 201708 | 9 | 9 | 9 | 9 | |
| 9 | 201708 | 2 | 2 | 2 | 2 | |
| 10 | 201708 | 3 | 3 | 3 | 3 | |
| 11 | 201708 | 4 | 4 | 4 | 4 | |
| 12 | 201708 | 5 | 5 | 5 | 5 | |
| 13 | 201708 | 6 | 6 | 6 | 6 | |
| 14 | 201710 | 7 | 7 | 7 | 7 | 7 |
| 15 | 201710 | 8 | 8 | 8 | 8 | 8 |
| 16 | 201710 | 9 | 9 | 9 | 9 | 9 |
| 17 | 201710 | 10 | 10 | 10 | 10 | 10 |
| 18 | 201711 | 11 | 11 | 11 | 11 | 11 |
| 19 | 201711 | 12 | 12 | 12 | 12 | 12 |
| 20 | 201711 | 13 | 13 | 13 | 13 | 13 |
| 21 | 201712 | 4 | ||||
| 22 | 201712 | 5 | ||||
| 23 | 201712 | 6 |
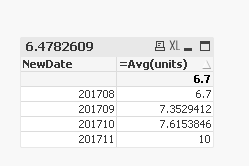
And the results woul be:
| Date | Avg |
| 201708 | 6,7 |
| 201709 | 7,35294118 |
| 201710 | 7,61538462 |
| 201711 | 10 |
I tried something with the function "Above" and "RangeAvg" but its not working fine.
Any clue to solve this issue?
Thanks in advance
- Mark as New
- Bookmark
- Subscribe
- Mute
- Subscribe to RSS Feed
- Permalink
- Report Inappropriate Content
Try this
Table:
LOAD id,
Date(Date#(date, 'YYYYMM'), 'YYYYMM') as date,
units;
LOAD * INLINE [
id, date, units
1, 201706, 2
2, 201706, 3
3, 201706, 4
4, 201707, 5
5, 201707, 6
6, 201707, 7
7, 201707, 8
8, 201708, 9
9, 201708, 2
10, 201708, 3
11, 201708, 4
12, 201708, 5
13, 201708, 6
14, 201710, 7
15, 201710, 8
16, 201710, 9
17, 201710, 10
18, 201711, 11
19, 201711, 12
20, 201711, 13
21, 201712, 4
22, 201712, 5
23, 201712, 6
];
Max:
LOAD Max(date) as MaxDate
Resident Table;
LET vMaxDate = Peek('MaxDate');
DROP Table Max;
FOR i = 1 to 4
TRACE $(i);
LinkTable:
LOAD Date(AddMonths($(vMaxDate), - $(i)), 'YYYYMM') as NewDate,
Date(AddMonths($(vMaxDate), - IterNo()), 'YYYYMM') as date
AutoGenerate 1
While IterNo() <= 2 + $(i);
NEXT i
Dimension
NewDate
Expression
Avg(units)