Unlock a world of possibilities! Login now and discover the exclusive benefits awaiting you.

- Qlik Community
- :
- All Forums
- :
- QlikView
- :
- Bar Chart Side by Side Comparison based on Dates
Options
- Subscribe to RSS Feed
- Mark Topic as New
- Mark Topic as Read
- Float this Topic for Current User
- Bookmark
- Subscribe
- Mute
- Printer Friendly Page
Turn on suggestions
Auto-suggest helps you quickly narrow down your search results by suggesting possible matches as you type.
Showing results for

Not applicable
2014-10-15
02:26 PM
- Mark as New
- Bookmark
- Subscribe
- Mute
- Subscribe to RSS Feed
- Permalink
- Report Inappropriate Content
Bar Chart Side by Side Comparison based on Dates
Hey guys,
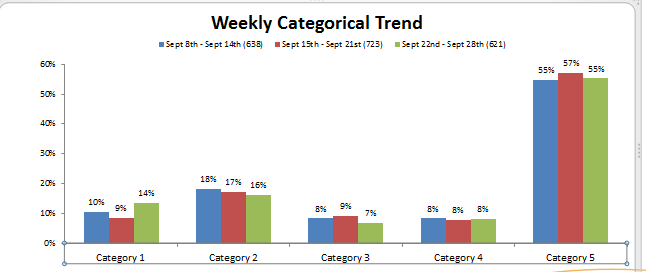
I want to create the graph that I have presented below. I have the dates as one field and the categories as another. Is there a way to create this graph.
Thanks for the help!
1,278 Views
3 Replies

 mr_novice
Creator II
2014-10-16
03:15 AM
- Mark as New
- Bookmark
- Subscribe
- Mute
- Subscribe to RSS Feed
- Permalink
- Report Inappropriate Content
Add Category as first dimension and week as second dimension in the bar chart. If you dont have the week dimension - create a calendar or just create a calculated dimension in the object week(Date Field).
Br
Cris
Not applicable
2014-10-16
03:38 PM
Author
- Mark as New
- Bookmark
- Subscribe
- Mute
- Subscribe to RSS Feed
- Permalink
- Report Inappropriate Content
Thank you for the help Cris!
1,075 Views

 MarcoWedel
MVP
2014-10-16
06:06 PM
- Mark as New
- Bookmark
- Subscribe
- Mute
- Subscribe to RSS Feed
- Permalink
- Report Inappropriate Content
Hi,
one solution could be:
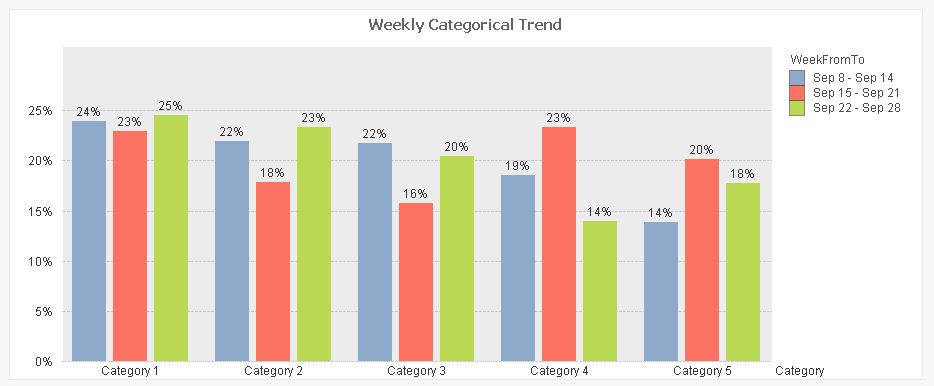
see attachment
hope this helps
regards
Marco
1,075 Views