Unlock a world of possibilities! Login now and discover the exclusive benefits awaiting you.
Announcements
Q&A with Qlik - Qlik Cloud Migration: Questions about migrating to Qlik Cloud? Catch the latest replay!
- Qlik Community
- :
- All Forums
- :
- QlikView
- :
- Bar chart
Options
- Subscribe to RSS Feed
- Mark Topic as New
- Mark Topic as Read
- Float this Topic for Current User
- Bookmark
- Subscribe
- Mute
- Printer Friendly Page
Turn on suggestions
Auto-suggest helps you quickly narrow down your search results by suggesting possible matches as you type.
Showing results for
Not applicable
2016-11-16
12:13 PM
- Mark as New
- Bookmark
- Subscribe
- Mute
- Subscribe to RSS Feed
- Permalink
- Report Inappropriate Content
Bar chart
Hello Everyone, how is it going?
Well, I have a doubt. I have a bar chart which is composed by 1 expression and 2 dimensions.
Ex: Production by machine by month;
Here is the thing, I want to show the values (data values) by machine and show the total either, like that:
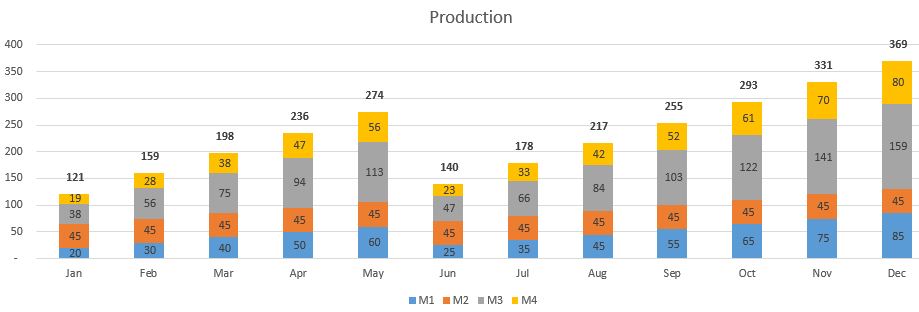
Do you guys have any ideas? Sincerely, Bisco
593 Views
1 Solution
Accepted Solutions
MVP
2016-11-16
12:39 PM
- Mark as New
- Bookmark
- Subscribe
- Mute
- Subscribe to RSS Feed
- Permalink
- Report Inappropriate Content
3 Replies
Partner - Champion III
2016-11-16
12:25 PM
- Mark as New
- Bookmark
- Subscribe
- Mute
- Subscribe to RSS Feed
- Permalink
- Report Inappropriate Content
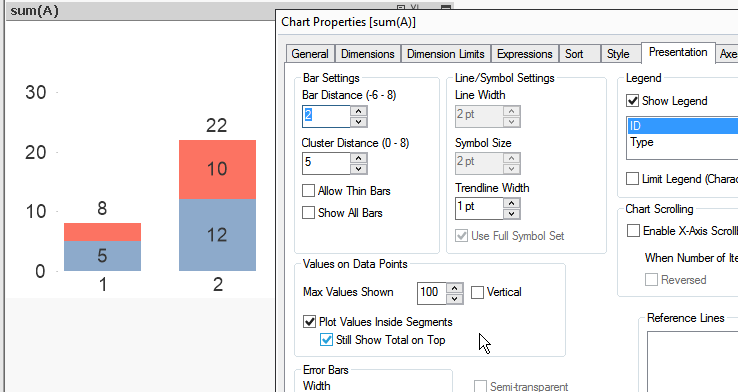
On the Presentation tab enable the options Plot Values Inside Segments and Still Show Total on Top.
talk is cheap, supply exceeds demand
Not applicable
2016-11-16
12:32 PM
Author
- Mark as New
- Bookmark
- Subscribe
- Mute
- Subscribe to RSS Feed
- Permalink
- Report Inappropriate Content
But once I enable that option, the top is automatically disabled.
551 Views
MVP
2016-11-16
12:39 PM
- Mark as New
- Bookmark
- Subscribe
- Mute
- Subscribe to RSS Feed
- Permalink
- Report Inappropriate Content
In my Qlik, 11,20 SR15 there is an option in Presentation tab