Unlock a world of possibilities! Login now and discover the exclusive benefits awaiting you.
- Qlik Community
- :
- All Forums
- :
- QlikView
- :
- Bar chart
- Subscribe to RSS Feed
- Mark Topic as New
- Mark Topic as Read
- Float this Topic for Current User
- Bookmark
- Subscribe
- Mute
- Printer Friendly Page
- Mark as New
- Bookmark
- Subscribe
- Mute
- Subscribe to RSS Feed
- Permalink
- Report Inappropriate Content
Bar chart
Hi,
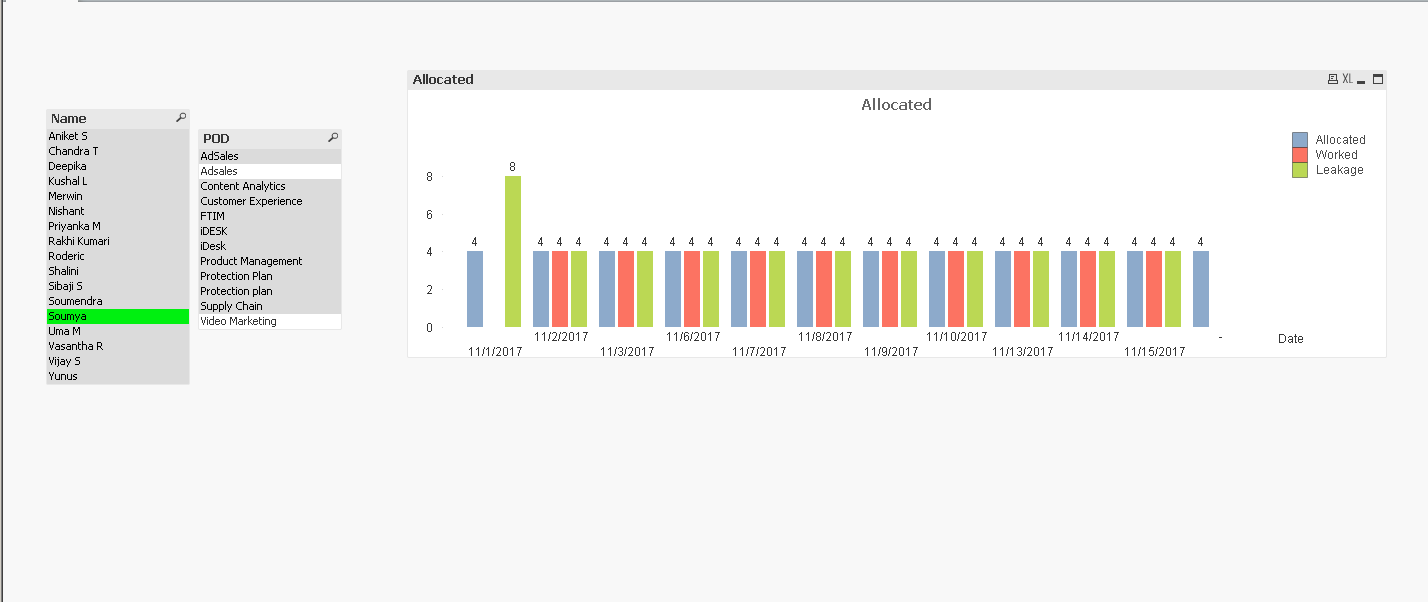
I want to create a leakage report using bar chart.
I want one bar showing actual allocated hours,
2nd bar showing hours worked and 3rd bar showing leakage(=actual -allocated)
I want it daily as well as week wise.
if I use sum(hours worked) expression for daily it is totalling the hours for the particular resource .
Please help me with this
- Mark as New
- Bookmark
- Subscribe
- Mute
- Subscribe to RSS Feed
- Permalink
- Report Inappropriate Content
Would you be able to share a sample to check this out?
- Mark as New
- Bookmark
- Subscribe
- Mute
- Subscribe to RSS Feed
- Permalink
- Report Inappropriate Content
I have data in both these files
- Mark as New
- Bookmark
- Subscribe
- Mute
- Subscribe to RSS Feed
- Permalink
- Report Inappropriate Content
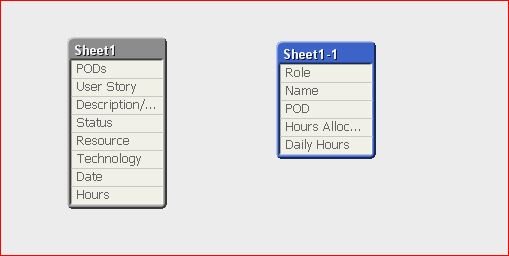
The outline alone is correct
I don't know what expression to use.
and for weekly data I have to roll up the dates keeping Friday as week end date.
please help with this
- Mark as New
- Bookmark
- Subscribe
- Mute
- Subscribe to RSS Feed
- Permalink
- Report Inappropriate Content
Hi,
Seems to the Table is not linked Properly
I think, if you correct that, the data will show proper.
- Mark as New
- Bookmark
- Subscribe
- Mute
- Subscribe to RSS Feed
- Permalink
- Report Inappropriate Content
how to connect the tables?
- Mark as New
- Bookmark
- Subscribe
- Mute
- Subscribe to RSS Feed
- Permalink
- Report Inappropriate Content
You have to find a common field between two tables then rename one of the fields to the that field which you want to make a key. For eg. if you think POD and PODs should match. Then just rename the Field PODs to Like PODs AS POD.
- Mark as New
- Bookmark
- Subscribe
- Mute
- Subscribe to RSS Feed
- Permalink
- Report Inappropriate Content
I thought it will become synthetic key
so I reamed POD as PODs in one of the file
and the connection works fine
the problem is with the expression.
- Mark as New
- Bookmark
- Subscribe
- Mute
- Subscribe to RSS Feed
- Permalink
- Report Inappropriate Content
After joining the tables the values displayed at the points are corrected.
but consider the worked hr for soumya is 0 for all the days, it is showing some other value.
Only for first date it is showing correctly