Unlock a world of possibilities! Login now and discover the exclusive benefits awaiting you.
- Qlik Community
- :
- All Forums
- :
- QlikView
- :
- CITY/MEMBER Dimension wise Cumulative %tile Calcul...
- Subscribe to RSS Feed
- Mark Topic as New
- Mark Topic as Read
- Float this Topic for Current User
- Bookmark
- Subscribe
- Mute
- Printer Friendly Page
- Mark as New
- Bookmark
- Subscribe
- Mute
- Subscribe to RSS Feed
- Permalink
- Report Inappropriate Content
CITY/MEMBER Dimension wise Cumulative %tile Calculation
Dear All,
i have table with CITY and MEMBER Dimension as below:
| MEMBER | CITY | TURNOVER |
|---|---|---|
| A | MUMBAI | 100 |
| A | DELHI | 200 |
| B | DELHI | 100 |
| B | MUMBAI | 300 |
| B | PUNE | 500 |
| C | DELHI | 50 |
| C | MUMBAI | 250 |
| C | PUNE | 600 |
| D | DELHI | 25 |
| D | MUMBAI | 50 |
| D | PUNE | 200 |
| E | MUMBAI | 25 |
| E | PUNE | 125 |
| E | DELHI | 225 |
| F | MUMBAI | 110 |
| F | PUNE | 150 |
| F | DELHI | 300 |
i have make table which show Memberwise Turnover along with Cumulative %tile ( i have used relative option with full accumulation)
CITY Selected : DELHI
| MEMBER | Sum(TURNOVER) | Cumlative %tile |
|---|---|---|
| 900 | 100.00% | |
| D | 25 | 2.78% |
| C | 50 | 8.33% |
| B | 100 | 19.44% |
| A | 200 | 41.67% |
| E | 225 | 66.67% |
| F | 300 | 100.00% |
In the Above table you can see Member 'A' have '41.67%' on DELHI City.
Now below is my requirement.
suppose select a Member 'A' then i want to see CITY wise Turnover of a MEMBER like below:
| CITY | Sum(TURNOVER) |
|---|---|
| 300 | |
| MUMBAI | 100 |
| DELHI | 200 |
In the above table i want to added a more column name 'Cumulative' which show the Member's Cumulative position which we seen on above table i.e. 41.67% . the output will as below:
| CITY | Sum(TURNOVER) | Cumlative |
|---|---|---|
| 300 | 0.00% | |
| MUMBAI | 100 | <what ever value as based of MUMBAI> |
| DELHI | 200 | 41.67% |
I am also attaching the sample QVW for ready reference.
Kindly help.
Thanks & Regards,
Jitendra K Vishwakarma
- Mark as New
- Bookmark
- Subscribe
- Mute
- Subscribe to RSS Feed
- Permalink
- Report Inappropriate Content
Create a Straight Table
Dimension
CITY
Expressions
1)SUM(TURNOVER)
2)SUM(TURNOVER)/SUM({1}TOTAL <CITY> TURNOVER)
Go to number tab to make 1st Expression as Integer and 2nd as %
- Mark as New
- Bookmark
- Subscribe
- Mute
- Subscribe to RSS Feed
- Permalink
- Report Inappropriate Content
This is wrong .. this is not what i want..
| CITY | Sum(TURNOVER) | SUM(TURNOVER)/SUM({1}TOTAL <CITY> TURNOVER) |
|---|---|---|
| 300 | 100.00% | |
| MUMBAI | 100 | 35.02% |
| DELHI | 200 | 64.98% |
- Mark as New
- Bookmark
- Subscribe
- Mute
- Subscribe to RSS Feed
- Permalink
- Report Inappropriate Content
If you select A what should be the answer? Please suggest...
- Mark as New
- Bookmark
- Subscribe
- Mute
- Subscribe to RSS Feed
- Permalink
- Report Inappropriate Content
this is also wrong what i dont want
| CITY | Sum(TURNOVER) | SUM(TURNOVER)/SUM({1}TOTAL <CITY> TURNOVER) |
|---|---|---|
| 300 | 9.06% | |
| MUMBAI | 100 | 11.98% |
| DELHI | 200 | 22.22% |
- Mark as New
- Bookmark
- Subscribe
- Mute
- Subscribe to RSS Feed
- Permalink
- Report Inappropriate Content
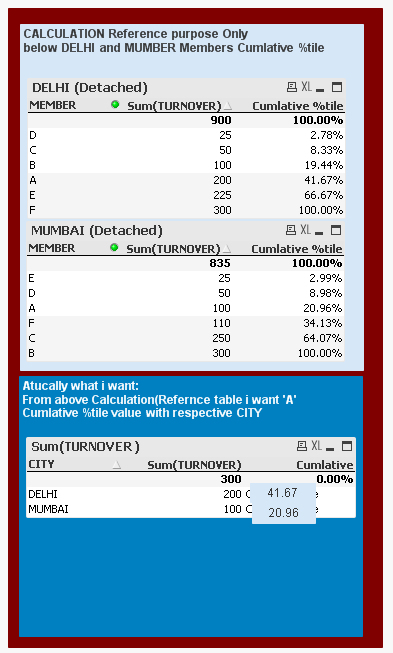
below is screen shot what i expect the answer the Cumlative % is not CITY wise cumulative%, it is actually in city wise cumulative % of Memberwise and if i selected 'A' then it show as below.
the below first two table is showing the position on Members in DELHI and MUMBAI separately . A position is at 41.67% in DELHI and in MUMBAI 20.96%
These two table is just to show what i am calculating value which i requried to show when i just see last third.
the third table is show result when i select 'A'
- Mark as New
- Bookmark
- Subscribe
- Mute
- Subscribe to RSS Feed
- Permalink
- Report Inappropriate Content
Like this?
- Mark as New
- Bookmark
- Subscribe
- Mute
- Subscribe to RSS Feed
- Permalink
- Report Inappropriate Content
Yes Right.. but you have done using load script. which don't want ... i am trying to do by set analysis only. because my original data is huge in size and date,year,month and many more dimension also....
- Mark as New
- Bookmark
- Subscribe
- Mute
- Subscribe to RSS Feed
- Permalink
- Report Inappropriate Content
Hi Jitendra,
I have loaded your given data in QlikView by using Excel.
Then Create one filter on City and create on table 1 which shows:
CITY Selected : DELHI
| MEMBER | Sum(TURNOVER) | Cumlative %tile |
|---|---|---|
| 900 | 100.00% | |
| D | 25 | 2.78% |
| C | 50 | 8.33% |
| B | 100 | 19.44% |
| A | 200 | 41.67% |
| E | 225 | 66.67% |
| F | 300 | 100.00% |
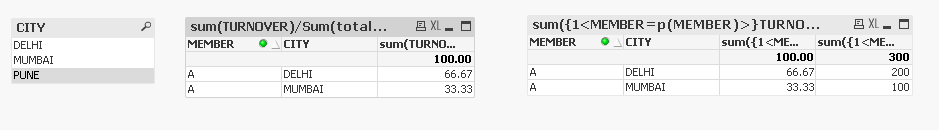
Now I have clone this table and created table 2. and in expression i have written:
sum({1<MEMBER=p(MEMBER)>}TURNOVER)/Sum({1<MEMBER=p(MEMBER)>}total TURNOVER)*100
So when you click on member,in table 1,table 2 will show citywise cumulative %.
- Mark as New
- Bookmark
- Subscribe
- Mute
- Subscribe to RSS Feed
- Permalink
- Report Inappropriate Content
No.. that is not my requirment
- Mark as New
- Bookmark
- Subscribe
- Mute
- Subscribe to RSS Feed
- Permalink
- Report Inappropriate Content
I think,this is what you want.