Unlock a world of possibilities! Login now and discover the exclusive benefits awaiting you.

- Qlik Community
- :
- All Forums
- :
- QlikView
- :
- Re: Calculated Dimension values in a table
- Subscribe to RSS Feed
- Mark Topic as New
- Mark Topic as Read
- Float this Topic for Current User
- Bookmark
- Subscribe
- Mute
- Printer Friendly Page

 melwilson
- Mark as New
- Bookmark
- Subscribe
- Mute
- Subscribe to RSS Feed
- Permalink
- Report Inappropriate Content
Calculated Dimension values in a table
Hi,
Can anyone help?
I am fairly new to QlikView. I want to create a table like this below similar to what I have in Excel:
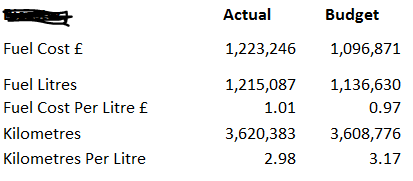
I have created a pivot table. Fuel Cost £, Fuel Litres and Kilometres are values in a KPI dimension field. Actual and Budget are calculated expressions with set analysis - e.g. sum({<KPI = {[Fuel Cost £],[Fuel Litres],[Kilometres]},[Actual Budget]= {Actual} >} Amount).
How do I create Fuel Cost Per Litre £ so that it appears below the Fuel Litres row?
Am I doing this wrong - should I be using another type of table ?
Thankyou for any advice.
Mel
Accepted Solutions

 rwunderlich
- Mark as New
- Bookmark
- Subscribe
- Mute
- Subscribe to RSS Feed
- Permalink
- Report Inappropriate Content
Yes, it could work. Enable "Partial Sums" on the chart on the Presentation tab to get Totals. You will then need to modify each expression to use a slightly different formula to calculate the total cell. The Dimensionality() function can be used to detect the Total cell,. Dimensionality()=0 for the total. So for example:
if(dimensionality() > 0
,sum({<KPI={'Fuel Cost'}>}Amount)
,sum({<KPI={'Fuel Cost'}, [Actual Budget]={'Actual'}>}Amount) - sum({<KPI={'Fuel Cost'}, [Actual Budget]={'Budget'}>}Amount)
)
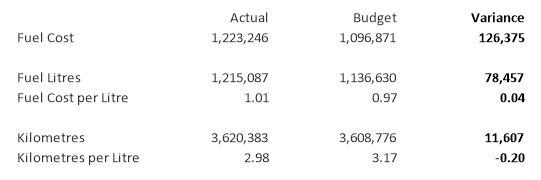
Updated example attached.
-Rob
rwunderlich
- Mark as New
- Bookmark
- Subscribe
- Mute
- Subscribe to RSS Feed
- Permalink
- Report Inappropriate Content
Here's the approach I would recommend.
1. Pivot Table with single Dimension: [Actual Budget]
2. Separate expression for each line, e.g.; sum({<KPI={'Fuel Cost'}>}Amount)
3. Drag the Dimension column to the upper right horizontal.
4. Drag the expressions to the left vertical.
The result can look like this:
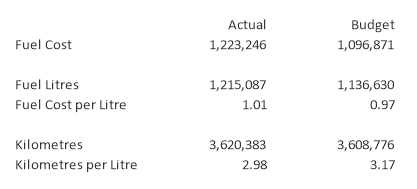
You can add some "blank" expressions to create separator lines . See attached qvw example.
-Rob
melwilson
- Mark as New
- Bookmark
- Subscribe
- Mute
- Subscribe to RSS Feed
- Permalink
- Report Inappropriate Content
Hi, Rob.
Wow, that's really good.
I have a follow-on question if you don't mind - if you want to show the difference between Actual and Budget as a third column would your solution still work ?
Thankyou,
Mel
rwunderlich
- Mark as New
- Bookmark
- Subscribe
- Mute
- Subscribe to RSS Feed
- Permalink
- Report Inappropriate Content
Yes, it could work. Enable "Partial Sums" on the chart on the Presentation tab to get Totals. You will then need to modify each expression to use a slightly different formula to calculate the total cell. The Dimensionality() function can be used to detect the Total cell,. Dimensionality()=0 for the total. So for example:
if(dimensionality() > 0
,sum({<KPI={'Fuel Cost'}>}Amount)
,sum({<KPI={'Fuel Cost'}, [Actual Budget]={'Actual'}>}Amount) - sum({<KPI={'Fuel Cost'}, [Actual Budget]={'Budget'}>}Amount)
)
Updated example attached.
-Rob
