Unlock a world of possibilities! Login now and discover the exclusive benefits awaiting you.

- Qlik Community
- :
- All Forums
- :
- QlikView
- :
- Calculating a rate
- Subscribe to RSS Feed
- Mark Topic as New
- Mark Topic as Read
- Float this Topic for Current User
- Bookmark
- Subscribe
- Mute
- Printer Friendly Page

- Mark as New
- Bookmark
- Subscribe
- Mute
- Subscribe to RSS Feed
- Permalink
- Report Inappropriate Content
Calculating a rate
Hi,
I have had a slight mathematical block... The attached file has 190 data entries which lists a 'Start Position' field of values I,N, S,
and a 'Outcome' field of 9 possibilities (values A-I)
I'm trying to display a bar chart for the Rate Outcomes of Start Position I but having no luck. I need to show something like the following:
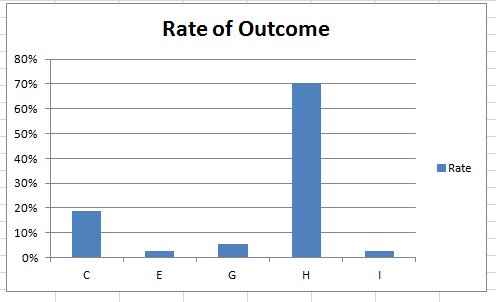
but when I attempt it in Qlikview each Outcome is at 100%
Any help appreciated.
Tom
- Tags:
- rates
- set analysis
Accepted Solutions

 rwunderlich
- Mark as New
- Bookmark
- Subscribe
- Mute
- Subscribe to RSS Feed
- Permalink
- Report Inappropriate Content
I think it would be:
Dim: OUTCOME
Expr: count({<START_POSITION={'I'}>}OUTCOME) / count(TOTAL {<START_POSITION={'I'}>}OUTCOME)
-Rob
Edit: Forgot the fieldname!
- Mark as New
- Bookmark
- Subscribe
- Mute
- Subscribe to RSS Feed
- Permalink
- Report Inappropriate Content
can u share your expression
 sunny_talwar
- Mark as New
- Bookmark
- Subscribe
- Mute
- Subscribe to RSS Feed
- Permalink
- Report Inappropriate Content
How would you calculate Rate Outcome of Start Position in your Excel file?
rwunderlich
- Mark as New
- Bookmark
- Subscribe
- Mute
- Subscribe to RSS Feed
- Permalink
- Report Inappropriate Content
I think it would be:
Dim: OUTCOME
Expr: count({<START_POSITION={'I'}>}OUTCOME) / count(TOTAL {<START_POSITION={'I'}>}OUTCOME)
-Rob
Edit: Forgot the fieldname!
- Mark as New
- Bookmark
- Subscribe
- Mute
- Subscribe to RSS Feed
- Permalink
- Report Inappropriate Content
Perfect - exactly what I was looking for!
Many thanks!