Unlock a world of possibilities! Login now and discover the exclusive benefits awaiting you.
- Qlik Community
- :
- All Forums
- :
- QlikView
- :
- Can't make a Bar Chart
- Subscribe to RSS Feed
- Mark Topic as New
- Mark Topic as Read
- Float this Topic for Current User
- Bookmark
- Subscribe
- Mute
- Printer Friendly Page
- Mark as New
- Bookmark
- Subscribe
- Mute
- Subscribe to RSS Feed
- Permalink
- Report Inappropriate Content
Can't make a Bar Chart
HI All,
I'm trying to make a chart out of the Categories column but its shows no data to display. I need to show the categories as bar with the dollar amounts on the left. I don't know if to use dimensions or not just need to display the categories.
Please provide assistance.
Thanks in advance
Accepted Solutions
- Mark as New
- Bookmark
- Subscribe
- Mute
- Subscribe to RSS Feed
- Permalink
- Report Inappropriate Content
Have you seen my second answer above?
- Mark as New
- Bookmark
- Subscribe
- Mute
- Subscribe to RSS Feed
- Permalink
- Report Inappropriate Content
Sorry, I haven't fully understood what you want to show.
Only category as dimension and then your expressions as grouped bars?
See attached for my current status
- Mark as New
- Bookmark
- Subscribe
- Mute
- Subscribe to RSS Feed
- Permalink
- Report Inappropriate Content
Ah, or maybe using a calculated dimension to re-calculated category:
=Aggr(
If(RangeAvg(SepRound, OctRound, NovRound, DecRound, JanRound, FebRound) <= 500, 'Small',
If(RangeAvg(SepRound, OctRound, NovRound, DecRound, JanRound, FebRound) <= 12000, 'Middle', 'Large'))
,[Customer Internal ID])
- Mark as New
- Bookmark
- Subscribe
- Mute
- Subscribe to RSS Feed
- Permalink
- Report Inappropriate Content
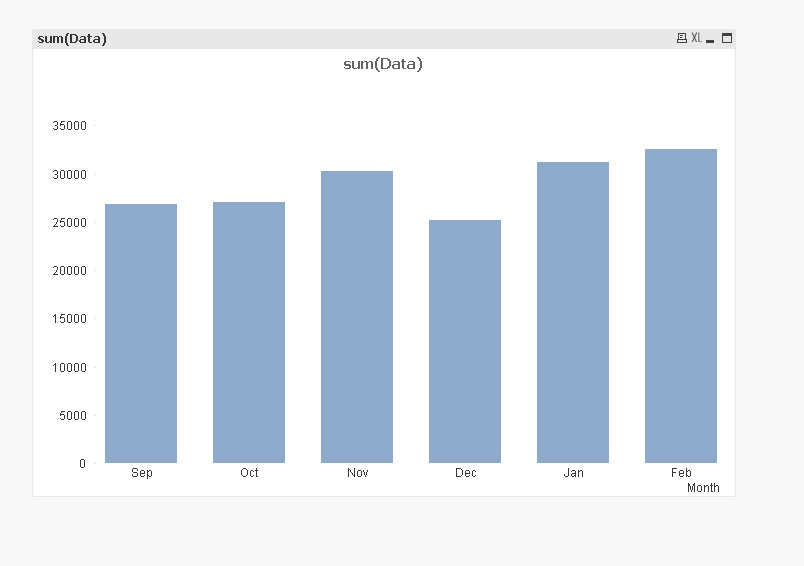
Thanks for the response for categories I'm using a formula.
=If(RangeAvg(SepRound, OctRound, NovRound, DecRound, JanRound, FebRound) <= 500, 'Small',
If(RangeAvg(SepRound, OctRound, NovRound, DecRound, JanRound, FebRound) <= 12000, 'Middle', 'Large'))
I want to have something like this, instead having small middle and large instead of the months and the figures all the left.
Please provide assistance.
- Mark as New
- Bookmark
- Subscribe
- Mute
- Subscribe to RSS Feed
- Permalink
- Report Inappropriate Content
Have you seen my second answer above?
- Mark as New
- Bookmark
- Subscribe
- Mute
- Subscribe to RSS Feed
- Permalink
- Report Inappropriate Content
Thanks Community Users, you guys are awesome always there to provide assistance!