Unlock a world of possibilities! Login now and discover the exclusive benefits awaiting you.

Announcements
Want to see what's currently in public preview? We've pulled it all together in one place. Check it out here
- Qlik Community
- :
- All Forums
- :
- QlikView
- :
- Chart Formatting
Options
- Subscribe to RSS Feed
- Mark Topic as New
- Mark Topic as Read
- Float this Topic for Current User
- Bookmark
- Subscribe
- Mute
- Printer Friendly Page
Turn on suggestions
Auto-suggest helps you quickly narrow down your search results by suggesting possible matches as you type.
Showing results for

Anonymous
Not applicable
2017-08-07
10:38 AM
- Mark as New
- Bookmark
- Subscribe
- Mute
- Subscribe to RSS Feed
- Permalink
- Report Inappropriate Content
Chart Formatting
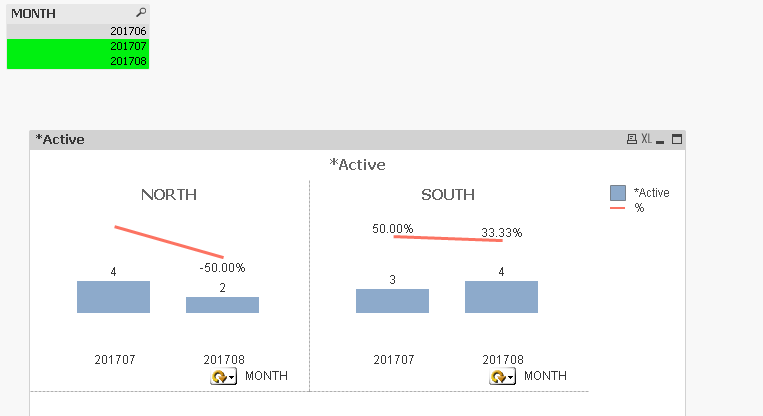
I have the below chart. There will be a trigger on the page that shows the max 2 months. What I would like to do is show the lattest two months but also show for my % dimension the last three months. So for example. the line graph would show the % for month 201706,201707 & 201708. (Visually I think that looks better)
The requestor would like to be able to filter on month when needed.
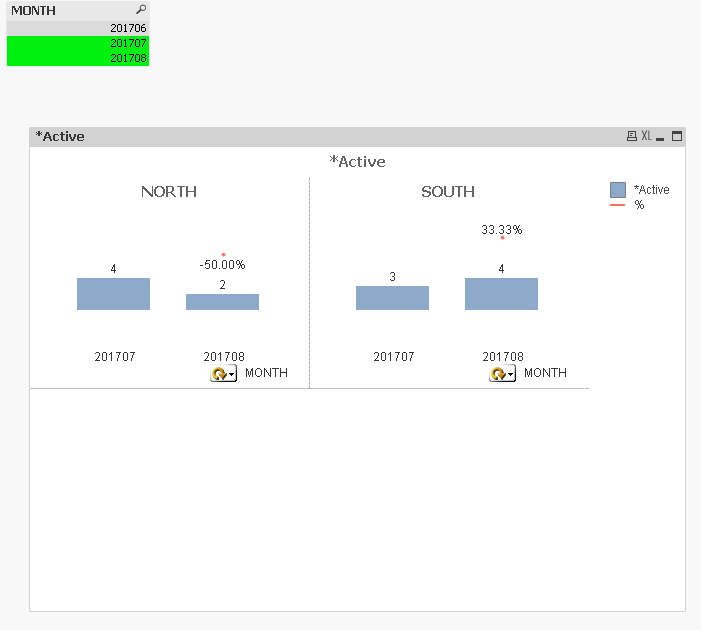
Like below but only showing two months and not three.
1,242 Views
3 Replies

2017-08-07
10:57 AM
- Mark as New
- Bookmark
- Subscribe
- Mute
- Subscribe to RSS Feed
- Permalink
- Report Inappropriate Content
Like this?

Best Anil, When applicable please mark the correct/appropriate replies as "solution" (you can mark up to 3 "solutions". Please LIKE threads if the provided solution is helpful
Anonymous
Not applicable
2017-08-07
01:11 PM
Author
- Mark as New
- Bookmark
- Subscribe
- Mute
- Subscribe to RSS Feed
- Permalink
- Report Inappropriate Content
Yes and I can still use the Month slicer? If so, can you attached the sample app?
1,151 Views

 sunny_talwar
MVP
2017-08-07
01:18 PM
- Mark as New
- Bookmark
- Subscribe
- Mute
- Subscribe to RSS Feed
- Permalink
- Report Inappropriate Content
Try this
Num(Count({<STATUS = {"1"} >} ID)/
Above(Count({<STATUS= {"1"}, MONTH>} ID), 1) - 1, '#.00%')