Unlock a world of possibilities! Login now and discover the exclusive benefits awaiting you.
- Qlik Community
- :
- All Forums
- :
- QlikView
- :
- Chart dimension interchange
- Subscribe to RSS Feed
- Mark Topic as New
- Mark Topic as Read
- Float this Topic for Current User
- Bookmark
- Subscribe
- Mute
- Printer Friendly Page
- Mark as New
- Bookmark
- Subscribe
- Mute
- Subscribe to RSS Feed
- Permalink
- Report Inappropriate Content
Chart dimension interchange
Good morning everyone!
I have simple pivot table, let say as below.
Where Scenario is Dimension and 1Q14, ..4Q14 are Expressions
Scenario 1Q15 2Q15 3Q15 4Q15
BB 3.0 3.5 2.4 3.7
BA 5.2 2.6 3.9 2.8
FB 1.9 4.5 3.5 3.1
FA 5.2 2.6 3.9 2.8
FSA 1.9 4.5 3.5 3.1
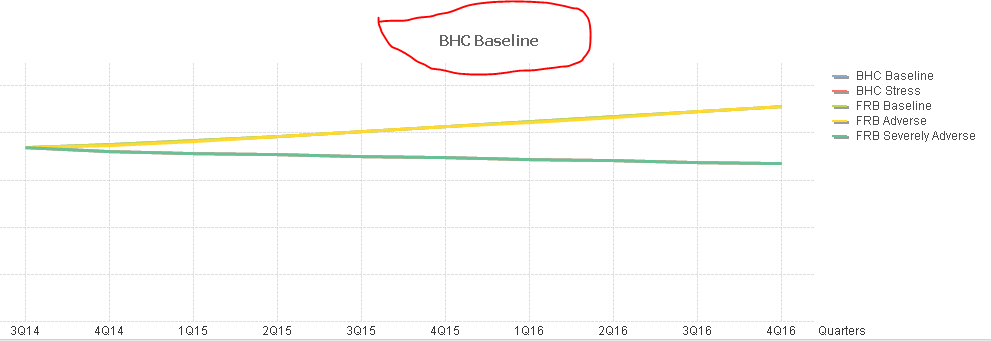
With above example I have been getting Line chart as
Scenario on X axis and all Expressions values being displayed on Y axis as attachment.
But I want other way like 1Q15...4Q15 on X-axis. I tried changing dimension on Pivot side but unable to do so.
Is there any way without redefine dimension on Pivot?
Thanks for your time
- « Previous Replies
-
- 1
- 2
- Next Replies »
- Mark as New
- Bookmark
- Subscribe
- Mute
- Subscribe to RSS Feed
- Permalink
- Report Inappropriate Content
Sum({$<QUARTER = {2}, LINE_NUMBER = {'7','21'}>} PROJECTION_VALUE)
1Q15 is basically QUARTER 2 in database
LINE_NUMBER is just for filter
- Mark as New
- Bookmark
- Subscribe
- Mute
- Subscribe to RSS Feed
- Permalink
- Report Inappropriate Content
Why don´t use Sum({$<LINE_NUMBER = {'7','21'}>} PROJECTION_VALUE) as expression and QUARTER as dimension?
- Mark as New
- Bookmark
- Subscribe
- Mute
- Subscribe to RSS Feed
- Permalink
- Report Inappropriate Content
I achived by this. Thanks
Now any idea how come I see only one Legend name at chart top?
Any idea to remove/hide?
- Mark as New
- Bookmark
- Subscribe
- Mute
- Subscribe to RSS Feed
- Permalink
- Report Inappropriate Content
This is set using at "Presentation Tab" , there is a textbox right below a check box called "show title in the chart"
- Mark as New
- Bookmark
- Subscribe
- Mute
- Subscribe to RSS Feed
- Permalink
- Report Inappropriate Content
Got it, thanks for valuable time 
- « Previous Replies
-
- 1
- 2
- Next Replies »