Unlock a world of possibilities! Login now and discover the exclusive benefits awaiting you.

- Qlik Community
- :
- All Forums
- :
- QlikView
- :
- Chart - line cut
- Subscribe to RSS Feed
- Mark Topic as New
- Mark Topic as Read
- Float this Topic for Current User
- Bookmark
- Subscribe
- Mute
- Printer Friendly Page

- Mark as New
- Bookmark
- Subscribe
- Mute
- Subscribe to RSS Feed
- Permalink
- Report Inappropriate Content
Chart - line cut
Hey Guys,
i have a problem with a specific chart.
I want to compare the development of the customer and the revenue created by them within 10 days. (Revenue divided by Amount of Clients, e.g. 100.000 Dollar / 10.000 Clients = 10 Dollar per client)
"Within 10 days" means that the client has 10 days time to generate revenue / buy the product after he has become a customer of my company.
I've created the following chart:
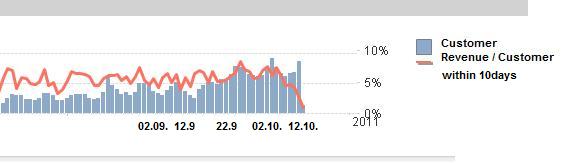
The picture above shows a decreasing line of the "Revenue per Customer". The reason is simple.. the new clients, which became a customer of my firm had e.g. only 2, 3 , 4 days time to bought the product, because they were only 2, 3, 4 days client of my company.
Is there a possibility to cut the line? So that the line will end ten days ago, like the following picture:
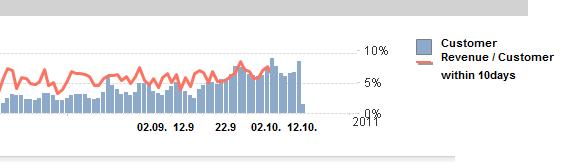
(pictures created with paint)
Anyone who has an idea?
Many thanks in advance!
Accepted Solutions

 matt_crowther
- Mark as New
- Bookmark
- Subscribe
- Mute
- Subscribe to RSS Feed
- Permalink
- Report Inappropriate Content
Not 100% this is the solution as you sound to have a fairly one off requirement.
I'd look to use an if() statement to control your line expression eg:
=if(Sale_Date<(today(1)-10),Sum(Sales),null())
Hope that solves it.
All the best,
Matt - Visual Analytics Ltd
matt_crowther
- Mark as New
- Bookmark
- Subscribe
- Mute
- Subscribe to RSS Feed
- Permalink
- Report Inappropriate Content
Not 100% this is the solution as you sound to have a fairly one off requirement.
I'd look to use an if() statement to control your line expression eg:
=if(Sale_Date<(today(1)-10),Sum(Sales),null())
Hope that solves it.
All the best,
Matt - Visual Analytics Ltd
- Mark as New
- Bookmark
- Subscribe
- Mute
- Subscribe to RSS Feed
- Permalink
- Report Inappropriate Content
Thank you very much! It works 🙂