Unlock a world of possibilities! Login now and discover the exclusive benefits awaiting you.
Announcements
ALERT: QlikView server communication interruptions following Microsoft Windows Domain Controller security updates
- Qlik Community
- :
- All Forums
- :
- QlikView
- :
- Chart showing incorrect Total
Options
- Subscribe to RSS Feed
- Mark Topic as New
- Mark Topic as Read
- Float this Topic for Current User
- Bookmark
- Subscribe
- Mute
- Printer Friendly Page
Turn on suggestions
Auto-suggest helps you quickly narrow down your search results by suggesting possible matches as you type.
Showing results for
Creator
2013-11-16
05:17 PM
- Mark as New
- Bookmark
- Subscribe
- Mute
- Subscribe to RSS Feed
- Permalink
- Report Inappropriate Content
Chart showing incorrect Total
Hello
I am having difficulty with a calculation and wanted to see if anyone could help. I’ve attached the QVW in case that helps you.
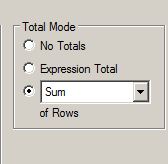
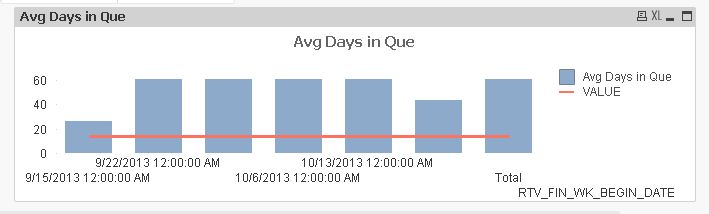
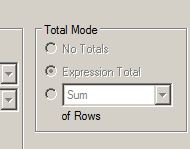
Basically the Count and Sum Days and Days in Que at the top of the table are calculating because of the Total mode. However in the Chart the Total Mode is grayed out so I don’t know how to get the Average Days in Que to be 35 instead of 61.
I'm not sure why I have to use the Total Mode I just found that it worked to calculate the correct sum for days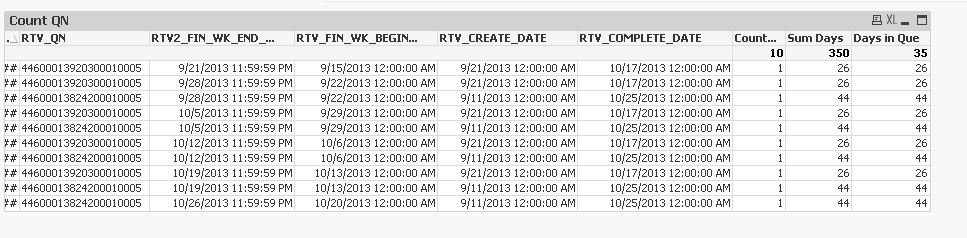
727 Views
1 Solution
Accepted Solutions
Champion III
2013-11-16
05:59 PM
- Mark as New
- Bookmark
- Subscribe
- Mute
- Subscribe to RSS Feed
- Permalink
- Report Inappropriate Content
Maybe like attached?
611 Views
2 Replies
Champion III
2013-11-16
05:59 PM
- Mark as New
- Bookmark
- Subscribe
- Mute
- Subscribe to RSS Feed
- Permalink
- Report Inappropriate Content
Maybe like attached?
612 Views
Creator
2013-11-16
06:07 PM
Author
- Mark as New
- Bookmark
- Subscribe
- Mute
- Subscribe to RSS Feed
- Permalink
- Report Inappropriate Content
Yep that was exactly it... Thank you so much for your help.
611 Views