Unlock a world of possibilities! Login now and discover the exclusive benefits awaiting you.

- Qlik Community
- :
- All Forums
- :
- QlikView
- :
- Chart with unique values on Dimension
- Subscribe to RSS Feed
- Mark Topic as New
- Mark Topic as Read
- Float this Topic for Current User
- Bookmark
- Subscribe
- Mute
- Printer Friendly Page

- Mark as New
- Bookmark
- Subscribe
- Mute
- Subscribe to RSS Feed
- Permalink
- Report Inappropriate Content
Chart with unique values on Dimension
Hello,
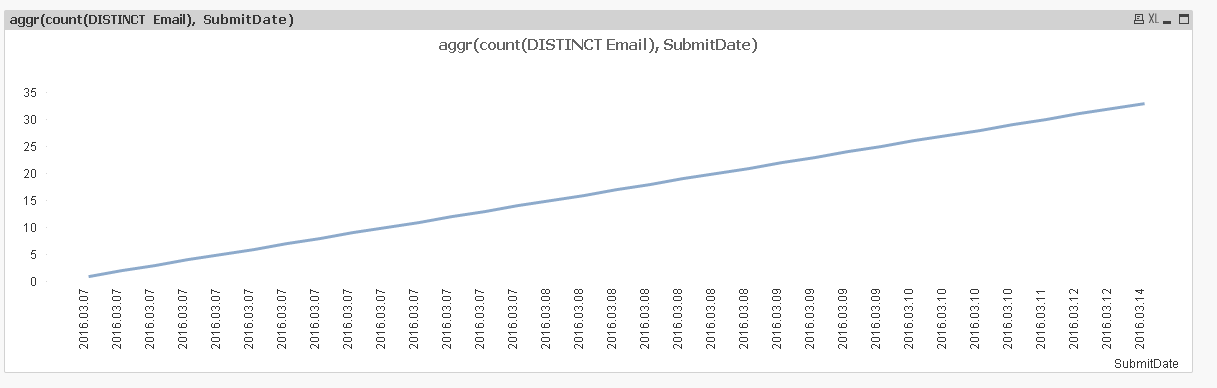
I have a line chart with Date as dimension and count Email address as expression.
The problem is that the chart shows all dates, instead of aggregating per date.
How can I show only unique values as dimension?
- « Previous Replies
-
- 1
- 2
- Next Replies »

 Chanty4u
- Mark as New
- Bookmark
- Subscribe
- Mute
- Subscribe to RSS Feed
- Permalink
- Report Inappropriate Content
hi,
= count(DISTINCT aggr(count( email),submtdate))
count( {<Column name={'Name'}>}Distinct Documnent2)
 sunny_talwar
- Mark as New
- Bookmark
- Subscribe
- Mute
- Subscribe to RSS Feed
- Permalink
- Report Inappropriate Content
I think your date field might look like a date field, but may contain time information making it to repeat in the chart. I suggest fixing this within your script. You can do something like this:
LOAD SubmitDate as SubmitTimeStamp,
Date(Floor(SubmitDate)) as SubmidDate
..
FROM Source

 amayuresh
- Mark as New
- Bookmark
- Subscribe
- Mute
- Subscribe to RSS Feed
- Permalink
- Report Inappropriate Content
Please post your sample Data.
Do you have time in Date field ?
- Mark as New
- Bookmark
- Subscribe
- Mute
- Subscribe to RSS Feed
- Permalink
- Report Inappropriate Content
may be this?
In Dimension Tab - > Update your Date Dimension with this -> Date(DateField)
sunny_talwar
- Mark as New
- Bookmark
- Subscribe
- Mute
- Subscribe to RSS Feed
- Permalink
- Report Inappropriate Content
Balraj that won't change a thing. You can do this instead -> Date(Floor(DateField)) to get rid of time portion
- Mark as New
- Bookmark
- Subscribe
- Mute
- Subscribe to RSS Feed
- Permalink
- Report Inappropriate Content
Is floor() really required??
In some cases I extract date from Date/Time field using same
sunny_talwar
- Mark as New
- Bookmark
- Subscribe
- Mute
- Subscribe to RSS Feed
- Permalink
- Report Inappropriate Content
If you have a timestamp field and the goal is to extract just the date portion, I am almost certain that you cannot do it without using Floor function. Because without floor the date will look like a date, but it will still contain the decimals representing time portion.
 Kushal_Chawda
- Mark as New
- Bookmark
- Subscribe
- Mute
- Subscribe to RSS Feed
- Permalink
- Report Inappropriate Content
try to do it in script like below
EmailCount:
load distinct SubmitDate,
SubmitDate as SubmitDateNew
Count(distinct Email) as EmailCount
resident your Data
group by SubmitDate;
Now Create the Chart,
Dimension:
SubmitDateNew
Expression:
Sum(EmailCount)
 Digvijay_Singh
- Mark as New
- Bookmark
- Subscribe
- Mute
- Subscribe to RSS Feed
- Permalink
- Report Inappropriate Content
Good one
- « Previous Replies
-
- 1
- 2
- Next Replies »