Unlock a world of possibilities! Login now and discover the exclusive benefits awaiting you.

- Qlik Community
- :
- All Forums
- :
- QlikView
- :
- Chart
Options
- Subscribe to RSS Feed
- Mark Topic as New
- Mark Topic as Read
- Float this Topic for Current User
- Bookmark
- Subscribe
- Mute
- Printer Friendly Page
Turn on suggestions
Auto-suggest helps you quickly narrow down your search results by suggesting possible matches as you type.
Showing results for

 bobbydave
Creator III
2016-08-31
07:21 AM
- Mark as New
- Bookmark
- Subscribe
- Mute
- Subscribe to RSS Feed
- Permalink
- Report Inappropriate Content
Chart
I have a chart
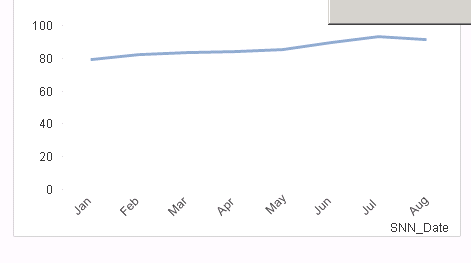
As you can imagine, the 60 and below is a waste.
1. My line will always be above 60
2. When I do this in Excel and the X-Axis omits anything less than 60 (I don't specify it), I can see the line has more of a curvature.
Can I make the X-Axis only show above 60?
934 Views
1 Solution
Accepted Solutions

 sunny_talwar
MVP
2016-08-31
07:23 AM
- Mark as New
- Bookmark
- Subscribe
- Mute
- Subscribe to RSS Feed
- Permalink
- Report Inappropriate Content
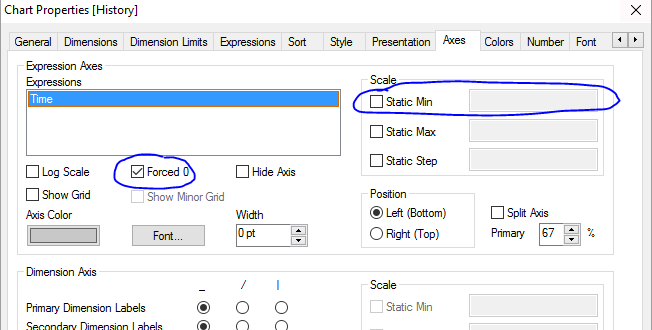
Sure, you can uncheck Forced 0 on the Axes tab or you can set a static min of 60 on the Axes tab again
883 Views
4 Replies
sunny_talwar
MVP
2016-08-31
07:23 AM
- Mark as New
- Bookmark
- Subscribe
- Mute
- Subscribe to RSS Feed
- Permalink
- Report Inappropriate Content
Sure, you can uncheck Forced 0 on the Axes tab or you can set a static min of 60 on the Axes tab again
884 Views

 amit_saini
Master III
2016-08-31
07:24 AM
- Mark as New
- Bookmark
- Subscribe
- Mute
- Subscribe to RSS Feed
- Permalink
- Report Inappropriate Content
Hi,
Try :

Thanks,
AS
883 Views
bobbydave
Creator III
2016-08-31
07:24 AM
Author
- Mark as New
- Bookmark
- Subscribe
- Mute
- Subscribe to RSS Feed
- Permalink
- Report Inappropriate Content
Saving the world again.
Thanks Sunny
883 Views
.png "sasikanth") sasikanth
sasikanth
Master
2016-08-31
07:24 AM
- Mark as New
- Bookmark
- Subscribe
- Mute
- Subscribe to RSS Feed
- Permalink
- Report Inappropriate Content
HI,
You can set scale in Chart properties --> Axis tab
Set Static Min, static max, and Static Step
883 Views
