Unlock a world of possibilities! Login now and discover the exclusive benefits awaiting you.

- Qlik Community
- :
- All Forums
- :
- QlikView
- :
- Color Based on Specific Date/Month Range/Period
- Subscribe to RSS Feed
- Mark Topic as New
- Mark Topic as Read
- Float this Topic for Current User
- Bookmark
- Subscribe
- Mute
- Printer Friendly Page

- Mark as New
- Bookmark
- Subscribe
- Mute
- Subscribe to RSS Feed
- Permalink
- Report Inappropriate Content
Color Based on Specific Date/Month Range/Period
Hi,
Suppose I have created line graph for GDP. On Y-axis I am having GDP value plotted against Date on X-axis.
I have created vStartDate and vEndDate. Now I want to change color of the line graph based on the range I am giving in the date selection.
E.g: Date: Jan/1950 to Dec/2016.
vStartDate: Jan/2001
vEndDate: Dec/2001
I want to assign color of the range, please not User can enter any range the want. The Color should changed based on that.
Thanks in advance.

 jonathandienst
- Mark as New
- Bookmark
- Subscribe
- Mute
- Subscribe to RSS Feed
- Permalink
- Report Inappropriate Content
It would be helpful if you explained how the colour relates to the selection in some detail, preferably with practical examples.
- Mark as New
- Bookmark
- Subscribe
- Mute
- Subscribe to RSS Feed
- Permalink
- Report Inappropriate Content
@Hi,
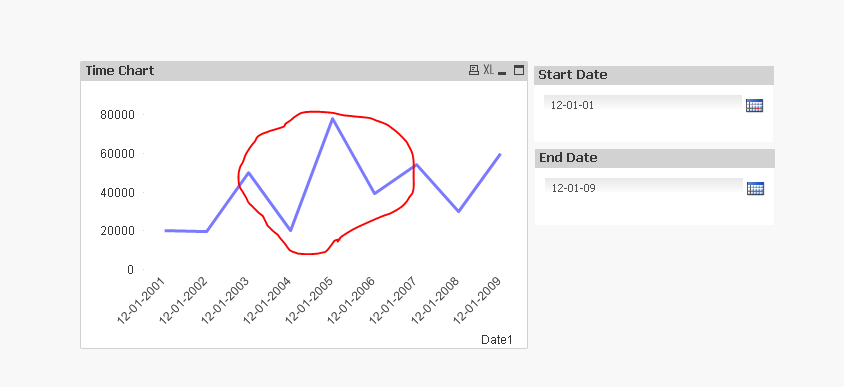
Thanks for reply. I am attaching an example file please look into it. What I am looking for is, the line remains plotted for all the year. Now I want to change color of the line graph for a particular period, like e.g the line remain plotted from year 2001-2009, but the period
selected in red circle in image, 2003-2007, color change for only this particular period.