Unlock a world of possibilities! Login now and discover the exclusive benefits awaiting you.

- Qlik Community
- :
- All Forums
- :
- QlikView
- :
- Compare Values in same column and return traffic l...
- Subscribe to RSS Feed
- Mark Topic as New
- Mark Topic as Read
- Float this Topic for Current User
- Bookmark
- Subscribe
- Mute
- Printer Friendly Page

- Mark as New
- Bookmark
- Subscribe
- Mute
- Subscribe to RSS Feed
- Permalink
- Report Inappropriate Content
Compare Values in same column and return traffic lights
Hello Team,
I have a column which shows YoY % for different types of membership , however , i need to compare the YoY % for diff countries and return traffic lights based on that. Below is the snapshot to get better understanding
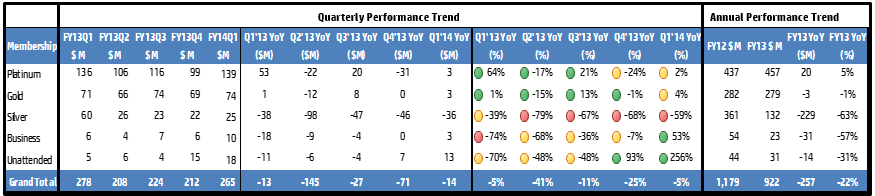
so when you look at the Q1'13YoY % , there are values across 5 types of membership, the desired outcome is
The maximum value out of this list should be identified
The 25% (1.25 out of 5 -rounded off to 2)of the highest values should be green
The next 50% (2.5 out of 5 rounded off to 2)of the values should be orange
The 25% (1.25 out of 5 rounded off to 1) of the highest values should be green
PS**The logic behind rounding off is just due to make the green one's more presentable
Can you please help me achieve this ???
Kind Regards,
Ravi