Unlock a world of possibilities! Login now and discover the exclusive benefits awaiting you.
- Qlik Community
- :
- All Forums
- :
- QlikView
- :
- Compare records
- Subscribe to RSS Feed
- Mark Topic as New
- Mark Topic as Read
- Float this Topic for Current User
- Bookmark
- Subscribe
- Mute
- Printer Friendly Page
- Mark as New
- Bookmark
- Subscribe
- Mute
- Subscribe to RSS Feed
- Permalink
- Report Inappropriate Content
Compare records
I have a Pivot table chart with 3 dimensions:
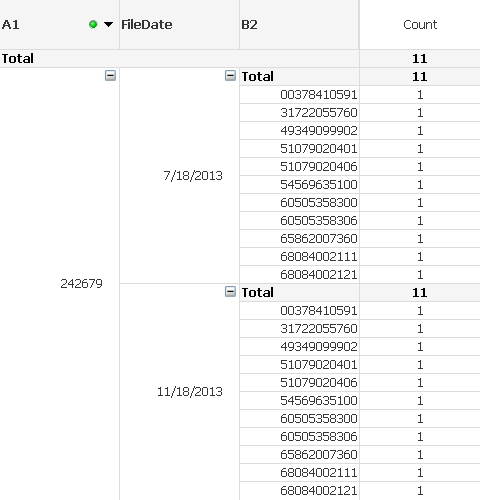
I need to find a way to compare records in B2 column between different FileDates (second dimension).
For example - display (highlight) records in column B2 for 7/18/2013 date that are not matching similar records for 11/18/2013 date.
Or create an expression that counts (and highlights) records from B2 Dimension for 7/18/2013 date that are not matching similar records for 11/18/2013 date
Any suggestions how to do that?
Regards,
Vladimir
- Tags:
- compare
- dimensions
Accepted Solutions
- Mark as New
- Bookmark
- Subscribe
- Mute
- Subscribe to RSS Feed
- Permalink
- Report Inappropriate Content
Hi Vlad,
It's a matter of defining two sets and then doing set operations to find the intersection or difference. The easiest way to define the two sets is to use Alternate States and select a File Date in each state. See the attached example of something similar I did earlier.
-Rob
- Mark as New
- Bookmark
- Subscribe
- Mute
- Subscribe to RSS Feed
- Permalink
- Report Inappropriate Content
Probably highlighting can be done using if statement as background expression of the dimension/expression. The counting would vary on presentation ( where/how you need that to be presented (text box/chart itself)). Share a sample qvw explaining your expected output there.
- Mark as New
- Bookmark
- Subscribe
- Mute
- Subscribe to RSS Feed
- Permalink
- Report Inappropriate Content
Hi Vlad,
It's a matter of defining two sets and then doing set operations to find the intersection or difference. The easiest way to define the two sets is to use Alternate States and select a File Date in each state. See the attached example of something similar I did earlier.
-Rob
- Mark as New
- Bookmark
- Subscribe
- Mute
- Subscribe to RSS Feed
- Permalink
- Report Inappropriate Content
Rob,
Thanks for the suggestion. This is exactly what I need.
Regards,
Vladimir