Unlock a world of possibilities! Login now and discover the exclusive benefits awaiting you.

- Qlik Community
- :
- All Forums
- :
- QlikView
- :
- Count If Expression
- Subscribe to RSS Feed
- Mark Topic as New
- Mark Topic as Read
- Float this Topic for Current User
- Bookmark
- Subscribe
- Mute
- Printer Friendly Page

 billuran
- Mark as New
- Bookmark
- Subscribe
- Mute
- Subscribe to RSS Feed
- Permalink
- Report Inappropriate Content
Count If Expression
Hello All, Here is my scenario. I have a file with multiple dates and values. I want to count the frequency of the total values for each date.
| Date | Volume |
|---|---|
| 1/1/17 | 1 |
| 1/1/17 | 2 |
| 1/2/17 | 2 |
so the totals for each date:
| Date | Volume Total |
|---|---|
| 1/1/17 | 3 |
| 1/2/17 | 2 |
Now I have another table where it is a list of values 0-1000 which i want to use to create a chart like below:
| Values | Count of values from table above |
|---|---|
| 1 | 0 |
| 2 | 1 |
| 3 | 1 |
How do i create this in script and expressions?
Message was edited by: Bill Uran
Accepted Solutions

 maxgro
- Mark as New
- Bookmark
- Subscribe
- Mute
- Subscribe to RSS Feed
- Permalink
- Report Inappropriate Content
let's my try in the script
// test data
s:
load * inline [
Date, Volume
1/1/17, 1
1/1/17, 2
1/2/17, 2
2/2/17, 3
3/2/17, 1
3/2/17, 2
3/2/17, 3
3/2/17, 4
20/2/17, 1
20/2/17, 10
21/2/17, 5
21/2/17, 6
];
// separate table from 0 to 1000
t:
LOAD
rowno()-1 as Values
AutoGenerate 1001;
tmp:
LOAD
Date, sum(Volume) as SumVolume
Resident s
Group By Date;
left join (t)
LOAD
SumVolume as Values, count(SumVolume) as CountValues
Resident tmp
group by SumVolume;
DROP Table tmp;
final:
NoConcatenate LOAD
Values,
Alt(CountValues,0) as CountValues
Resident t;
DROP Table t;
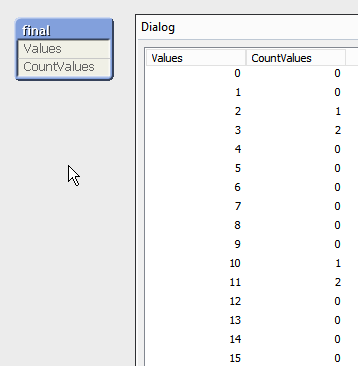

- Mark as New
- Bookmark
- Subscribe
- Mute
- Subscribe to RSS Feed
- Permalink
- Report Inappropriate Content
Here, How data similar to countv (01-01-2017 = 0 / 1 / .... / 1000)
Can you provide Data in dates try a luck 
Count({<date = P(countv)>}date)
billuran
- Mark as New
- Bookmark
- Subscribe
- Mute
- Subscribe to RSS Feed
- Permalink
- Report Inappropriate Content
I edited my question for further detail.
maxgro
- Mark as New
- Bookmark
- Subscribe
- Mute
- Subscribe to RSS Feed
- Permalink
- Report Inappropriate Content
Try in a chart with
dimension aggr(sum(Volume), Date)
expression count(aggr(sum(Volume), Date))
billuran
- Mark as New
- Bookmark
- Subscribe
- Mute
- Subscribe to RSS Feed
- Permalink
- Report Inappropriate Content
Massimo this is great but it will only show values that exist, i want the dimension values to come from a separate table that goes from 0-1000, with the field called Values.
maxgro
- Mark as New
- Bookmark
- Subscribe
- Mute
- Subscribe to RSS Feed
- Permalink
- Report Inappropriate Content
let's my try in the script
// test data
s:
load * inline [
Date, Volume
1/1/17, 1
1/1/17, 2
1/2/17, 2
2/2/17, 3
3/2/17, 1
3/2/17, 2
3/2/17, 3
3/2/17, 4
20/2/17, 1
20/2/17, 10
21/2/17, 5
21/2/17, 6
];
// separate table from 0 to 1000
t:
LOAD
rowno()-1 as Values
AutoGenerate 1001;
tmp:
LOAD
Date, sum(Volume) as SumVolume
Resident s
Group By Date;
left join (t)
LOAD
SumVolume as Values, count(SumVolume) as CountValues
Resident tmp
group by SumVolume;
DROP Table tmp;
final:
NoConcatenate LOAD
Values,
Alt(CountValues,0) as CountValues
Resident t;
DROP Table t;
billuran
- Mark as New
- Bookmark
- Subscribe
- Mute
- Subscribe to RSS Feed
- Permalink
- Report Inappropriate Content
Worked Perfect, thank you.
