Unlock a world of possibilities! Login now and discover the exclusive benefits awaiting you.

- Qlik Community
- :
- All Forums
- :
- QlikView
- :
- Create Chart Using As-Of Table With Date Compariso...
- Subscribe to RSS Feed
- Mark Topic as New
- Mark Topic as Read
- Float this Topic for Current User
- Bookmark
- Subscribe
- Mute
- Printer Friendly Page

 Kosakamaka
- Mark as New
- Bookmark
- Subscribe
- Mute
- Subscribe to RSS Feed
- Permalink
- Report Inappropriate Content
Create Chart Using As-Of Table With Date Comparison
Hello all, long time lurker here but first-time poster. I am reaching out to the community as I am currently at whit’s end creating the chart described below. The image directly below represents the data that is currently being pulled into QlikView.
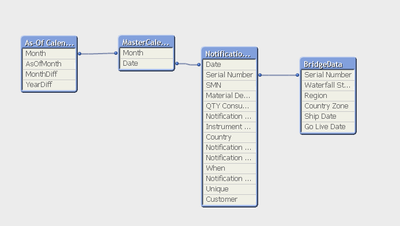
Using the above data, I am attempting to count the number of instruments that have gone live by a certain month. To do this I created an As-Of Calendar which aggregates all information until a respective month (this is AsOfMonth). My Rational for doing this was as follows:
- Use AsOfMoth as the dimension for my chart
- For each AsOfMonth, count the number of distinct Serial Numbers that have a Go Live Date less that or equal to the AsOfMonth
I used the As-Of Calendar and AsOfMonth successfully to count the total number of serial numbers created until a given AsofMonth but was not able to take this one step further. All attempts led to either a failure to generate results, or results that were totally nonsensical. Any help would be greatly appreciated.
Thank you,
Rob


- Mark as New
- Bookmark
- Subscribe
- Mute
- Subscribe to RSS Feed
- Permalink
- Report Inappropriate Content
Can you try one of these?
Count({<[Serial Number]={"=[Go Live Date]<=AsOfMonth"}>}DISTINCT [Serial Number])
Count({<[AsOfMonth]={"=[Go Live Date]<=AsOfMonth"}>}DISTINCT [Serial Number])