Unlock a world of possibilities! Login now and discover the exclusive benefits awaiting you.

- Qlik Community
- :
- All Forums
- :
- QlikView
- :
- Create Pivot Table in Load Script
- Subscribe to RSS Feed
- Mark Topic as New
- Mark Topic as Read
- Float this Topic for Current User
- Bookmark
- Subscribe
- Mute
- Printer Friendly Page

- Mark as New
- Bookmark
- Subscribe
- Mute
- Subscribe to RSS Feed
- Permalink
- Report Inappropriate Content
Create Pivot Table in Load Script
Hi QV Expert:
I'm trying to create a pivot table in the load script because I need to add other calculation in the front end. My source data is in chart 1. The processed table should look like chart 2, with columns…
- Preferred (N)/ Preferred (Y): the count of sellers that are labeled N/Y in the Preferred column in chart 1.
- % of Preferred: Preferred (Y)/(Preferred (Y)+Preferred (N))
- Has Preferred?: Y if Preferred (Y)> 0
Can someone help with the script? I was using "if (Preferred= 'Y', Count ([Seller]),0) as 'Preferred (Y)'" for Preferred (Y), but it didn't seem to work…
Thanks!
chart 1
| Item | Seller | Preferred Seller |
| Apple | Farm A | Y |
| Apple | Farm C | N |
| Orange | Farm C | N |
| Orange | Farm A | Y |
| Orange | Farm B | N |
| Pear | Farm B | N |
| Pear | Farm A | Y |
| Watermelon | Farm B | N |
| Watermelon | Farm D | N |
Chart 2
| Item | Preferred (N) | Preferred (Y) | % of Preferred | Has preferred? |
| Apple | 1 | 1 | 50% | Y |
| Orange | 2 | 1 | 33% | Y |
| Pear | 1 | 1 | 50% | Y |
| Watermelon | 2 | 0 | 0% | N |
Accepted Solutions

 sinanozdemir
- Mark as New
- Bookmark
- Subscribe
- Mute
- Subscribe to RSS Feed
- Permalink
- Report Inappropriate Content
Hi,
Here is my approach:
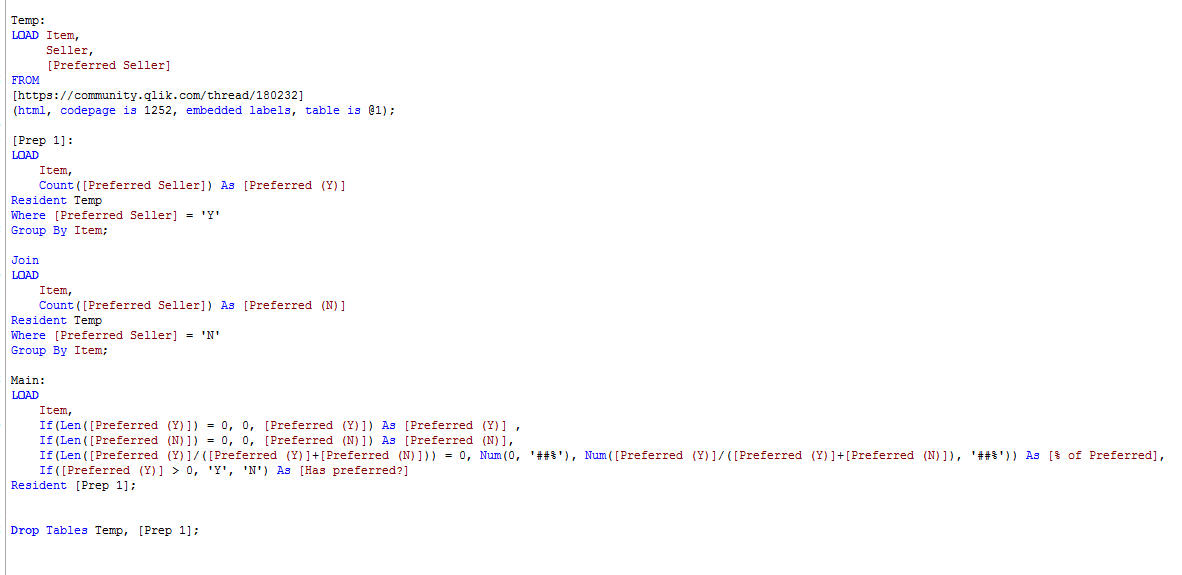
Here is the data model:
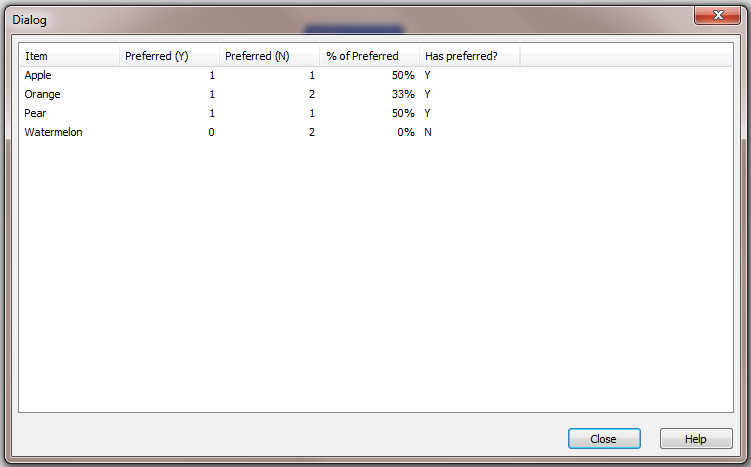
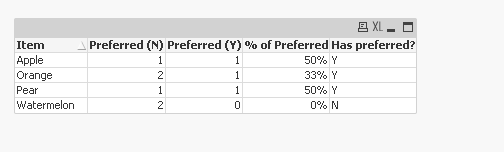
I am also attaching the qvw.
Hope this helps.
sinanozdemir
- Mark as New
- Bookmark
- Subscribe
- Mute
- Subscribe to RSS Feed
- Permalink
- Report Inappropriate Content
Hi,
Here is my approach:
Here is the data model:
I am also attaching the qvw.
Hope this helps.