Unlock a world of possibilities! Login now and discover the exclusive benefits awaiting you.

Announcements
Share your agentic AI experience, learn from others, and earn a new badge: Put Agentic AI to Work
- Qlik Community
- :
- All Forums
- :
- QlikView
- :
- Create pie charts
Options
- Subscribe to RSS Feed
- Mark Topic as New
- Mark Topic as Read
- Float this Topic for Current User
- Bookmark
- Subscribe
- Mute
- Printer Friendly Page
Turn on suggestions
Auto-suggest helps you quickly narrow down your search results by suggesting possible matches as you type.
Showing results for

Not applicable
2016-07-25
05:53 PM
- Mark as New
- Bookmark
- Subscribe
- Mute
- Subscribe to RSS Feed
- Permalink
- Report Inappropriate Content
Create pie charts
This is my dataset
region total value1 value2
NY 100 60 40
London 150 85 65
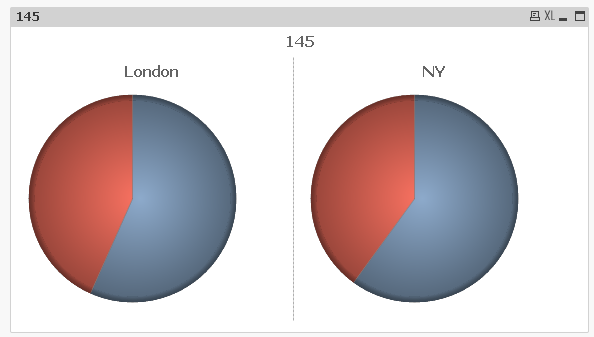
I want to create for NY a pie chart which has then 100 split across 60 and 40 and one for London which has the split of 85 and 65. How can I create these 2 pie charts?
1,078 Views
1 Solution
Accepted Solutions

 sunny_talwar
MVP
2016-07-25
06:17 PM
- Mark as New
- Bookmark
- Subscribe
- Mute
- Subscribe to RSS Feed
- Permalink
- Report Inappropriate Content
1,010 Views
2 Replies
sunny_talwar
MVP
2016-07-25
06:10 PM
- Mark as New
- Bookmark
- Subscribe
- Mute
- Subscribe to RSS Feed
- Permalink
- Report Inappropriate Content
May be use trellis chart?
1,010 Views
sunny_talwar
MVP
2016-07-25
06:17 PM
- Mark as New
- Bookmark
- Subscribe
- Mute
- Subscribe to RSS Feed
- Permalink
- Report Inappropriate Content
Like this:
1,011 Views