Unlock a world of possibilities! Login now and discover the exclusive benefits awaiting you.

- Qlik Community
- :
- All Forums
- :
- QlikView
- :
- Creating a line chart without using continuous
- Subscribe to RSS Feed
- Mark Topic as New
- Mark Topic as Read
- Float this Topic for Current User
- Bookmark
- Subscribe
- Mute
- Printer Friendly Page

 markgraham123
- Mark as New
- Bookmark
- Subscribe
- Mute
- Subscribe to RSS Feed
- Permalink
- Report Inappropriate Content
Creating a line chart without using continuous
Hi,
I'm struck at a point where i have to display the data using Line chart.
Since i have thousands of records on X-axis, i have to use Continuous to show the trend at a time.
But when i use "Continuous" i'm not getting the order i need.
Can someone look in to the attached application and lemme know how can i load in the same order which is specified in the table of the application.
I'm trying to get o/p like the attached image.
 markgraham123
- Mark as New
- Bookmark
- Subscribe
- Mute
- Subscribe to RSS Feed
- Permalink
- Report Inappropriate Content
SKU on x-axis and other dimension on Y-axis.

 MarcoWedel
- Mark as New
- Bookmark
- Subscribe
- Mute
- Subscribe to RSS Feed
- Permalink
- Report Inappropriate Content
Hi,
one solution could be:
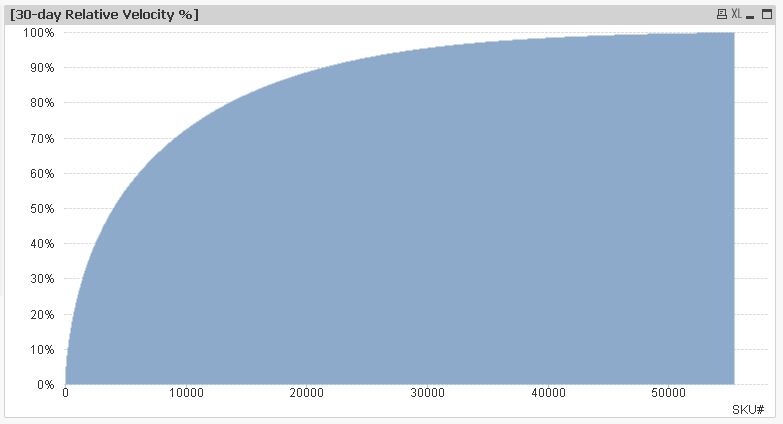
table1:
LOAD Dual(SKU#,RecNo()) as SKU#,
    [30-day Relative Velocity %]
FROM  (txt, utf8, embedded labels, delimiter is '\t', msq, no eof);
hope this helps
regards
Marco
