Unlock a world of possibilities! Login now and discover the exclusive benefits awaiting you.

- Qlik Community
- :
- All Forums
- :
- QlikView
- :
- Creating a "Stephen Few" bullet chart
- Subscribe to RSS Feed
- Mark Topic as New
- Mark Topic as Read
- Float this Topic for Current User
- Bookmark
- Subscribe
- Mute
- Printer Friendly Page

 ajaysingh285
- Mark as New
- Bookmark
- Subscribe
- Mute
- Subscribe to RSS Feed
- Permalink
- Report Inappropriate Content
Creating a "Stephen Few" bullet chart
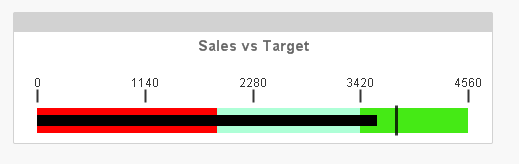
I am getting problem while plotting the "Stephen Few" bullet chart, as i followed the same process that is written in cookbook for developers, and please explain this concept also.
I know it is used in stock market and all these things, but wanted to know why we used this?
Thanks in advance
- Tags:
- new_to_qlikview

 swuehl
- Mark as New
- Bookmark
- Subscribe
- Mute
- Subscribe to RSS Feed
- Permalink
- Report Inappropriate Content
If have problem following the description of the cookbook, please describe what your issues are, post current sample etc.
If you want to know the concept behind, just google for "stephen few bullet chart":
https://www.perceptualedge.com/articles/misc/Bullet_Graph_Design_Spec.pdf
ajaysingh285
- Mark as New
- Bookmark
- Subscribe
- Mute
- Subscribe to RSS Feed
- Permalink
- Report Inappropriate Content
is there any video also ?

 maxgro
- Mark as New
- Bookmark
- Subscribe
- Mute
- Subscribe to RSS Feed
- Permalink
- Report Inappropriate Content
Bullet chart is used to display single measures, like gauges.
More detail here
Visual Business Intelligence – Bullet Graphs for Not-to-Exceed Targets
https://www.perceptualedge.com/articles/misc/Bullet_Graph_Design_Spec.pdf
in the attachment the bullet chart of the book