Unlock a world of possibilities! Login now and discover the exclusive benefits awaiting you.

- Qlik Community
- :
- All Forums
- :
- QlikView
- :
- Creating and Configuring bar chart using variables
Options
- Subscribe to RSS Feed
- Mark Topic as New
- Mark Topic as Read
- Float this Topic for Current User
- Bookmark
- Subscribe
- Mute
- Printer Friendly Page
Turn on suggestions
Auto-suggest helps you quickly narrow down your search results by suggesting possible matches as you type.
Showing results for

Anonymous
Not applicable
2016-10-26
11:29 AM
- Mark as New
- Bookmark
- Subscribe
- Mute
- Subscribe to RSS Feed
- Permalink
- Report Inappropriate Content
Creating and Configuring bar chart using variables
how we create the relationship between the Excel (Config file-attached) and reflect the changes Bar chart.
I need to define max and minimum values in Excel and to reflect the changes in the chart. I dont need to be hard coded and defined in the Excel.
Please refer the attached file for reference.
697 Views
2 Replies

 sunny_talwar
MVP
2016-10-26
12:32 PM
- Mark as New
- Bookmark
- Subscribe
- Mute
- Subscribe to RSS Feed
- Permalink
- Report Inappropriate Content
Not sure I understand what you are looking to do? What is your expected output?
665 Views
Anonymous
Not applicable
2016-10-26
01:31 PM
Author
- Mark as New
- Bookmark
- Subscribe
- Mute
- Subscribe to RSS Feed
- Permalink
- Report Inappropriate Content
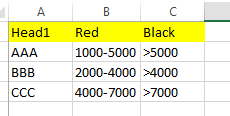
Ex: For AAA, if we change the value 2000-5000 in config, it should calculate the count of ID’s with the amount >2000-5000
665 Views