Unlock a world of possibilities! Login now and discover the exclusive benefits awaiting you.
Announcements
Now accepting applications for the Qlik Luminary and Partner Ambassador Programs: Apply by July 6!
- Qlik Community
- :
- All Forums
- :
- QlikView
- :
- Custom Y-axis scale
Options
- Subscribe to RSS Feed
- Mark Topic as New
- Mark Topic as Read
- Float this Topic for Current User
- Bookmark
- Subscribe
- Mute
- Printer Friendly Page
Turn on suggestions
Auto-suggest helps you quickly narrow down your search results by suggesting possible matches as you type.
Showing results for
Not applicable
2014-04-11
12:18 PM
- Mark as New
- Bookmark
- Subscribe
- Mute
- Subscribe to RSS Feed
- Permalink
- Report Inappropriate Content
Custom Y-axis scale
I need to create a bar chart with a custom Y-axis scale (-125 to -10) where -125 is the minimum value and -10 is the maximum value and vertical bars go up with -10 being a larger bar than -125.
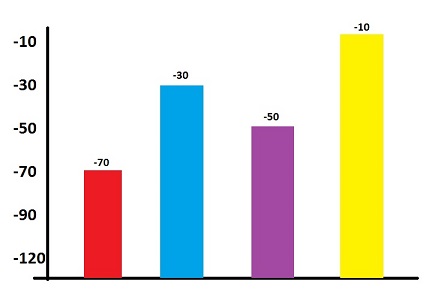
I have experimented with using the dual command to modify my expressions for custom label at the top of each bar, but I really need the values listed along the Y-axis to align with the values being displayed. Is this possible?
- Tags:
- axis
3,212 Views
- « Previous Replies
-
- 1
- 2
- Next Replies »
12 Replies
Not applicable
2014-04-11
02:04 PM
Author
- Mark as New
- Bookmark
- Subscribe
- Mute
- Subscribe to RSS Feed
- Permalink
- Report Inappropriate Content
PERFECT!!!!!
Thanks
371 Views
Anonymous
Not applicable
2014-04-11
02:09 PM
Author
- Mark as New
- Bookmark
- Subscribe
- Mute
- Subscribe to RSS Feed
- Permalink
- Report Inappropriate Content
Thanks.
(I like the "simply" part  )
)
371 Views
MVP
2014-04-11
02:18 PM
- Mark as New
- Bookmark
- Subscribe
- Mute
- Subscribe to RSS Feed
- Permalink
- Report Inappropriate Content

371 Views
- « Previous Replies
-
- 1
- 2
- Next Replies »