Unlock a world of possibilities! Login now and discover the exclusive benefits awaiting you.

- Qlik Community
- :
- All Forums
- :
- QlikView
- :
- Daily curves
Options
- Subscribe to RSS Feed
- Mark Topic as New
- Mark Topic as Read
- Float this Topic for Current User
- Bookmark
- Subscribe
- Mute
- Printer Friendly Page
Turn on suggestions
Auto-suggest helps you quickly narrow down your search results by suggesting possible matches as you type.
Showing results for

 master_student
Creator III
2017-09-19
10:16 AM
- Mark as New
- Bookmark
- Subscribe
- Mute
- Subscribe to RSS Feed
- Permalink
- Report Inappropriate Content
Daily curves
Hello Guys,
I missed you 
I need your help so
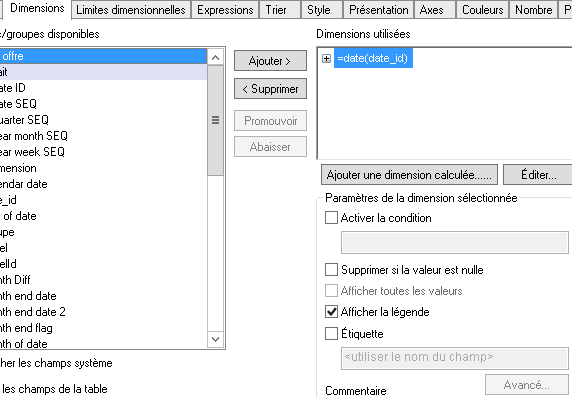
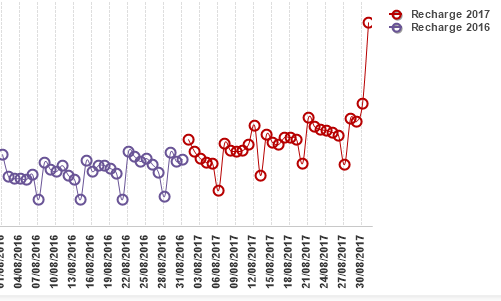
I have a graph that display the amout in a daily way of year 2017 VS 2016. I need the lines (curves) to be superimposed,
any idea please?
My expression :
sum({$<[Year of date]={$(=Max([Year of date]))} >}recharge_amount)
sum({$<[Year of date]={$(=Max([Year of date])-1)} >}recharge_amount)
896 Views
1 Solution
Accepted Solutions

 sunny_talwar
MVP
2017-09-19
10:21 AM
- Mark as New
- Bookmark
- Subscribe
- Mute
- Subscribe to RSS Feed
- Permalink
- Report Inappropriate Content
Change your dimension to this
Date(SetDateYear(date_id, Year(Today())), 'DD/MM')
843 Views
2 Replies
sunny_talwar
MVP
2017-09-19
10:21 AM
- Mark as New
- Bookmark
- Subscribe
- Mute
- Subscribe to RSS Feed
- Permalink
- Report Inappropriate Content
Change your dimension to this
Date(SetDateYear(date_id, Year(Today())), 'DD/MM')
844 Views
master_student
Creator III
2017-09-19
12:33 PM
Author
- Mark as New
- Bookmark
- Subscribe
- Mute
- Subscribe to RSS Feed
- Permalink
- Report Inappropriate Content
Thanks a lot
843 Views
