Unlock a world of possibilities! Login now and discover the exclusive benefits awaiting you.

Announcements
Share your agentic AI experience, learn from others, and earn a new badge: Put Agentic AI to Work
- Qlik Community
- :
- All Forums
- :
- QlikView
- :
- Data Labels
Options
- Subscribe to RSS Feed
- Mark Topic as New
- Mark Topic as Read
- Float this Topic for Current User
- Bookmark
- Subscribe
- Mute
- Printer Friendly Page
Turn on suggestions
Auto-suggest helps you quickly narrow down your search results by suggesting possible matches as you type.
Showing results for

 EGilbert
Contributor III
2019-11-21
03:07 PM
- Mark as New
- Bookmark
- Subscribe
- Mute
- Subscribe to RSS Feed
- Permalink
- Report Inappropriate Content
Data Labels
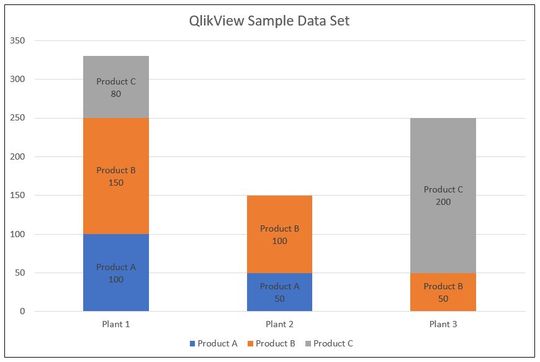
I would like to add data labels inside my chart columns. Is this possible in QlikView? I would like it to look like the below chart. Thanks for the help.
963 Views
1 Solution
Accepted Solutions

 bharathadde
Creator II
2019-11-21
03:14 PM
- Mark as New
- Bookmark
- Subscribe
- Mute
- Subscribe to RSS Feed
- Permalink
- Report Inappropriate Content
Use this in your expression
=Dual([Product Name Field] & chr(10) & Sum(Sales) ,Sum(Sales))
and make sure you checkbox Plot Values inside segment on Presentation tab
1 Reply
bharathadde
Creator II
2019-11-21
03:14 PM
- Mark as New
- Bookmark
- Subscribe
- Mute
- Subscribe to RSS Feed
- Permalink
- Report Inappropriate Content
Use this in your expression
=Dual([Product Name Field] & chr(10) & Sum(Sales) ,Sum(Sales))
and make sure you checkbox Plot Values inside segment on Presentation tab
