Unlock a world of possibilities! Login now and discover the exclusive benefits awaiting you.
- Qlik Community
- :
- All Forums
- :
- QlikView
- :
- Re: Date Format
- Subscribe to RSS Feed
- Mark Topic as New
- Mark Topic as Read
- Float this Topic for Current User
- Bookmark
- Subscribe
- Mute
- Printer Friendly Page
- Mark as New
- Bookmark
- Subscribe
- Mute
- Subscribe to RSS Feed
- Permalink
- Report Inappropriate Content
Date Format
Hello,
I have the format MM/DD/YYYY HH:MM:SS and i am trying to MM/DD/YYYY
I don't know why this is showing.
I tried like below
date(date#(First_StartTime,'MM/DD/YYYY HH:MM:SS'),'MM/DD/YYYY')
- « Previous Replies
-
- 1
- 2
- Next Replies »
- Mark as New
- Bookmark
- Subscribe
- Mute
- Subscribe to RSS Feed
- Permalink
- Report Inappropriate Content
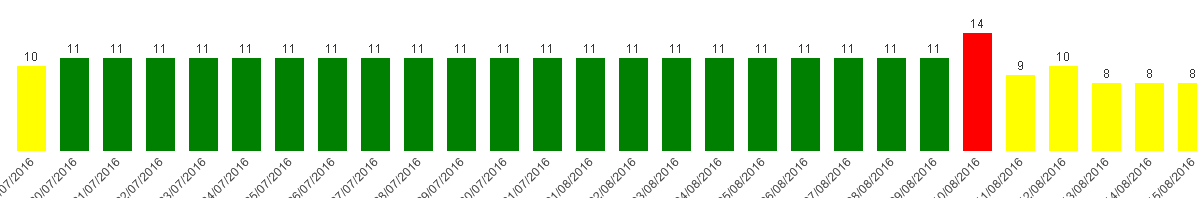
Yes, Thanks Sunny. 10 also need to show different like blue then yellow? I am about to finish this
- Mark as New
- Bookmark
- Subscribe
- Mute
- Subscribe to RSS Feed
- Permalink
- Report Inappropriate Content
Try this:
=If([Dashboard Running] = Max(TOTAL Aggr(Count(DISTINCT Dashboard), First_StartTime)), LightRed(),
If([Dashboard Running] = Max(TOTAL Aggr(Count(DISTINCT Dashboard), First_StartTime), 2), Green(),
If([Dashboard Running] = Max(TOTAL Aggr(Count(DISTINCT Dashboard), First_StartTime), 3), Blue(), Yellow())))

- Mark as New
- Bookmark
- Subscribe
- Mute
- Subscribe to RSS Feed
- Permalink
- Report Inappropriate Content
interesting, Thanks.
- Mark as New
- Bookmark
- Subscribe
- Mute
- Subscribe to RSS Feed
- Permalink
- Report Inappropriate Content
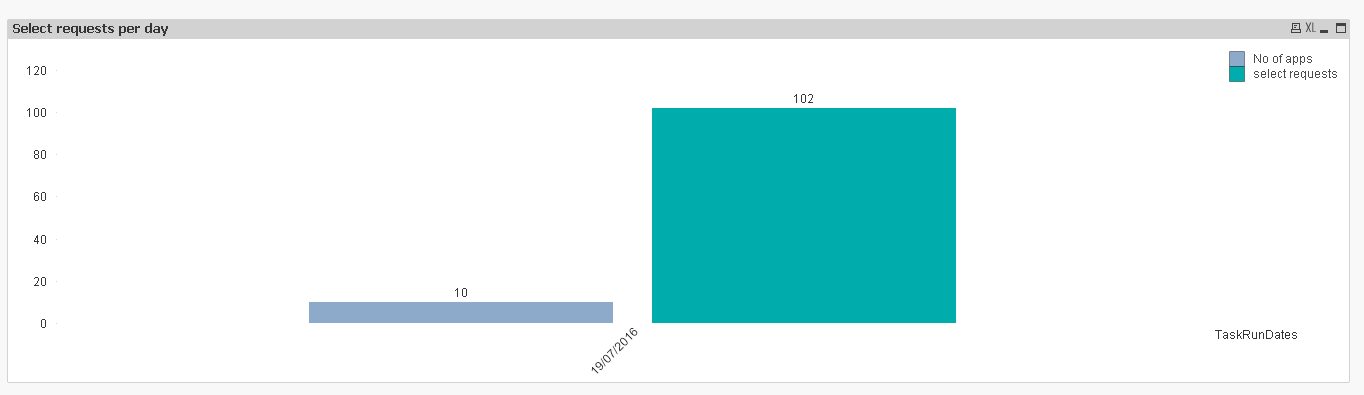
Sunny, I have one more doubt.
Can you please have a look which i attached below.
Here, what i want to achieve is From sheet3 I have values for 19/07/2016 are 102
But, While i am trying Sheet2 Bar graph Why this is showing 128 for 19/07/2016. Can you please suggest me?
- Mark as New
- Bookmark
- Subscribe
- Mute
- Subscribe to RSS Feed
- Permalink
- Report Inappropriate Content
Because the Sheet3 expression seems to be distinct values per dimension. To get 102 on the chart, try this:
=Sum(Aggr([count of select], Dashboard))
or
=Sum(Aggr(Only([count of select]), Dashboard))
or
=Sum(Aggr(Avg([count of select]), Dashboard))
or
=Sum(Aggr(Sum(DISTINCT [count of select]), Dashboard))
- Mark as New
- Bookmark
- Subscribe
- Mute
- Subscribe to RSS Feed
- Permalink
- Report Inappropriate Content
Yes, here why not showing values by date wise. And, I've tried that. Unfortunately, the dates are not showing good way. How to figure it out.
- Mark as New
- Bookmark
- Subscribe
- Mute
- Subscribe to RSS Feed
- Permalink
- Report Inappropriate Content
Looking to get this?
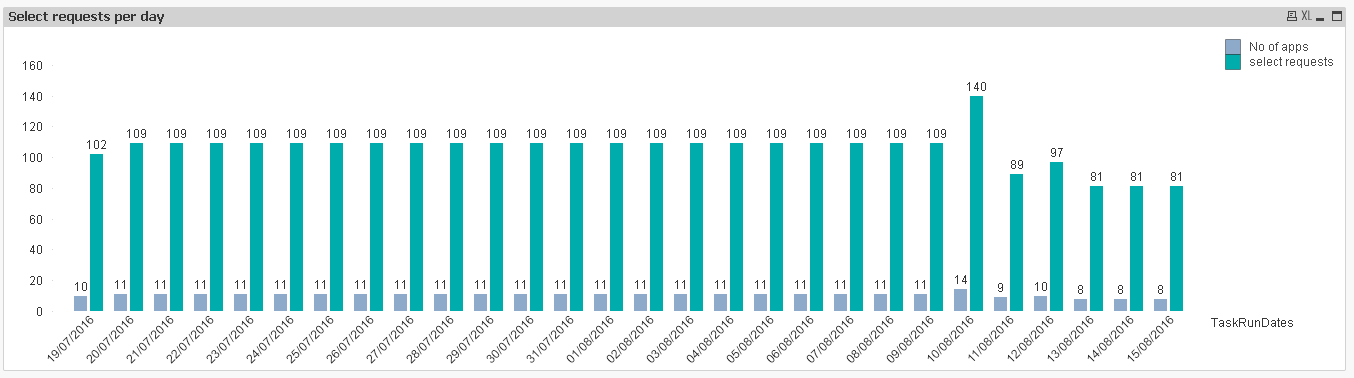
Expression:
=Sum(Aggr([count of select], Dashboard, TaskRunDates))
- Mark as New
- Bookmark
- Subscribe
- Mute
- Subscribe to RSS Feed
- Permalink
- Report Inappropriate Content
Thanks for your time.
- Mark as New
- Bookmark
- Subscribe
- Mute
- Subscribe to RSS Feed
- Permalink
- Report Inappropriate Content
No problem at all Anil. I just recommend to start a new thread with new requirement in the future.
Thanks,
Sunny
- « Previous Replies
-
- 1
- 2
- Next Replies »