Unlock a world of possibilities! Login now and discover the exclusive benefits awaiting you.

- Qlik Community
- :
- All Forums
- :
- QlikView
- :
- Defining Segment in Gauge Chart
- Subscribe to RSS Feed
- Mark Topic as New
- Mark Topic as Read
- Float this Topic for Current User
- Bookmark
- Subscribe
- Mute
- Printer Friendly Page

 mhmmd_srf
- Mark as New
- Bookmark
- Subscribe
- Mute
- Subscribe to RSS Feed
- Permalink
- Report Inappropriate Content
Defining Segment in Gauge Chart
HI All,
I have gauge chart.
I want to show :
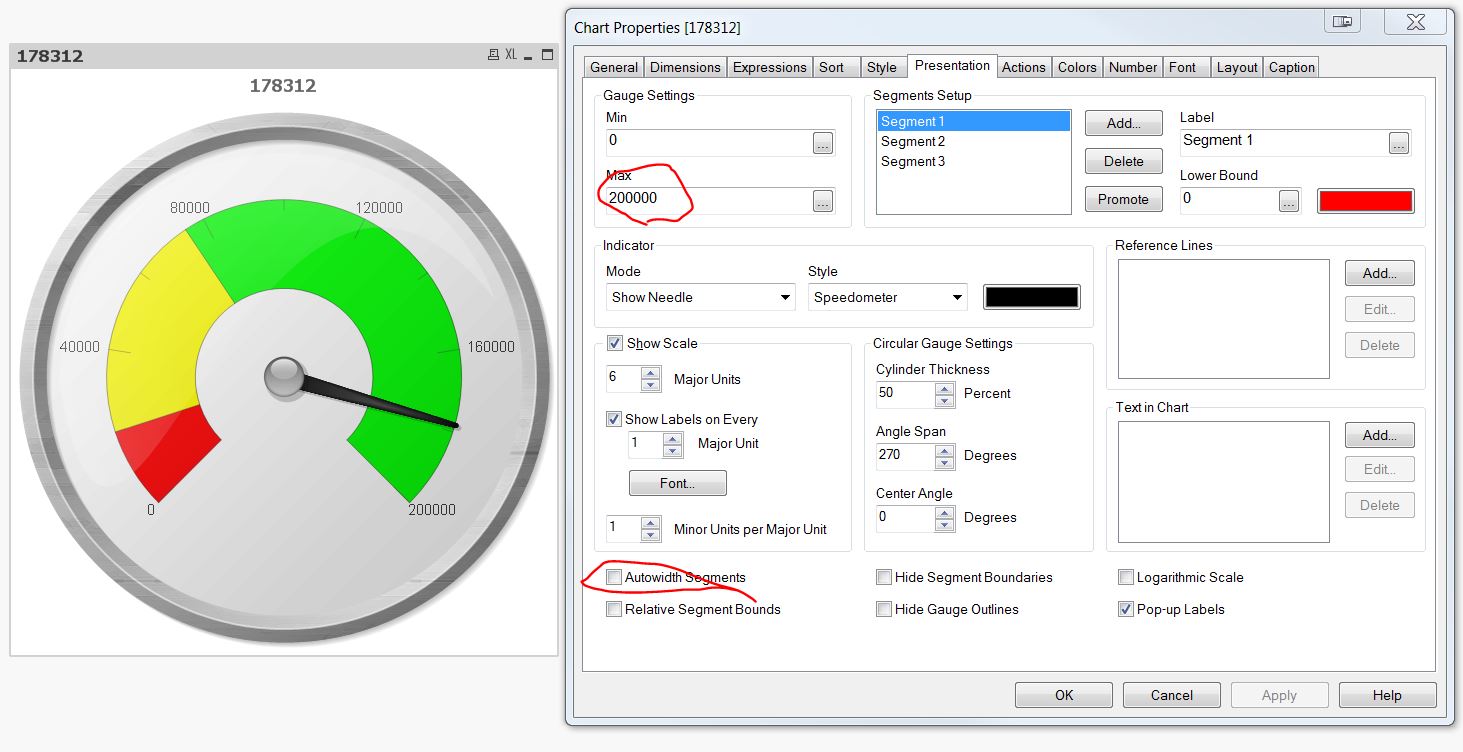
<20,000 = Red
>= 20,000 and < 75000 = Yellow
>= 75000 = Green.
I am not able to change Lower Bound of Segment.
Can anyone please help me.
Thanks,
Sarif
Accepted Solutions

 MK_QSL
- Mark as New
- Bookmark
- Subscribe
- Mute
- Subscribe to RSS Feed
- Permalink
- Report Inappropriate Content
MK_QSL
- Mark as New
- Bookmark
- Subscribe
- Mute
- Subscribe to RSS Feed
- Permalink
- Report Inappropriate Content
check this..
mhmmd_srf
- Mark as New
- Bookmark
- Subscribe
- Mute
- Subscribe to RSS Feed
- Permalink
- Report Inappropriate Content
Thanks Manish...
One more thing.
In level I want to show only 0, 20000, 75000 and 200000.
Not 40k,80k... etc.
How to do this.
Thanks,
Sarif
MK_QSL
- Mark as New
- Bookmark
- Subscribe
- Mute
- Subscribe to RSS Feed
- Permalink
- Report Inappropriate Content
I am not getting. what is level here?
mhmmd_srf
- Mark as New
- Bookmark
- Subscribe
- Mute
- Subscribe to RSS Feed
- Permalink
- Report Inappropriate Content
Hi Manish,
I am trying to say about this..

MK_QSL
- Mark as New
- Bookmark
- Subscribe
- Mute
- Subscribe to RSS Feed
- Permalink
- Report Inappropriate Content
We don't have control on them...
You can increase or decrease the data point by selecting Show Scale Major Units..
mhmmd_srf
- Mark as New
- Bookmark
- Subscribe
- Mute
- Subscribe to RSS Feed
- Permalink
- Report Inappropriate Content
okk
mhmmd_srf
- Mark as New
- Bookmark
- Subscribe
- Mute
- Subscribe to RSS Feed
- Permalink
- Report Inappropriate Content
What is the difference b/w Major Units and Minor Units?
MK_QSL
- Mark as New
- Bookmark
- Subscribe
- Mute
- Subscribe to RSS Feed
- Permalink
- Report Inappropriate Content
Try to play with it.. you will realise the difference...
Minor units means units between major units..
Say you have cm between meter and mm between cm.
