Unlock a world of possibilities! Login now and discover the exclusive benefits awaiting you.

- Qlik Community
- :
- All Forums
- :
- QlikView
- :
- Dimensions - why - same conditions make different ...
- Subscribe to RSS Feed
- Mark Topic as New
- Mark Topic as Read
- Float this Topic for Current User
- Bookmark
- Subscribe
- Mute
- Printer Friendly Page

 uacg0009
- Mark as New
- Bookmark
- Subscribe
- Mute
- Subscribe to RSS Feed
- Permalink
- Report Inappropriate Content
Dimensions - why - same conditions make different results
Hi all,
Sorry at first I need to say maybe this problem is a little abstract, because I can't do an example for this.
Problem is :
I have a chart and there are two dimensions in this chart.
situation 1:
the two dimensions are:
1:
2:
And result is :
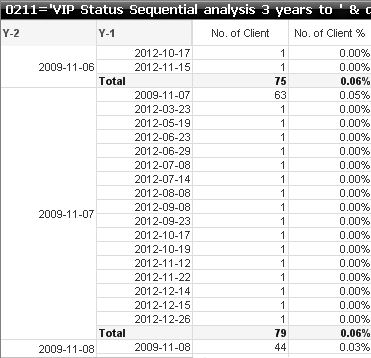
what I want to say is that you can see there are some data in column Y-1 >= column Y-2, like 2012-03-23>2009-11-07.
BUT if I use these two dimensions, the result is different:
1:
2:
the second one don't change, in the first formula, I want to show the count item cat1 but not period date dt.
The result is :
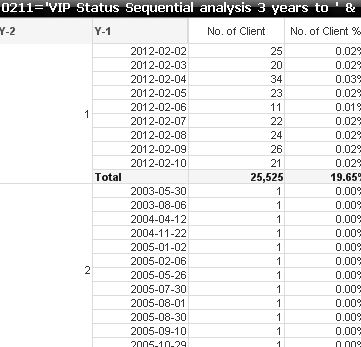
Now I think you can see the difference, what I want to say is there is no data(period date dt) in column Y-1 > column Y-2.
I don't know why? the data in column Y-1 now all less than 2012-02-10. ( 2012-02-10 is the max period date dt of column Y-2)
why I do this change in the first dimension will affect the nearly all results of column Y-1. All data in column Y-1 > Y-2 are gone.
Is there a method to make the column Y-1 like before and also calculate the count item cat1?
I hope I have clarified what I want and if you have any questions pls tell me.
Thank you so much!
