Unlock a world of possibilities! Login now and discover the exclusive benefits awaiting you.

Announcements
Want to see what's currently in public preview? We've pulled it all together in one place. Check it out here
- Qlik Community
- :
- All Forums
- :
- QlikView
- :
- Dimensions
Options
- Subscribe to RSS Feed
- Mark Topic as New
- Mark Topic as Read
- Float this Topic for Current User
- Bookmark
- Subscribe
- Mute
- Printer Friendly Page
Turn on suggestions
Auto-suggest helps you quickly narrow down your search results by suggesting possible matches as you type.
Showing results for

Not applicable
2015-04-15
04:46 AM
- Mark as New
- Bookmark
- Subscribe
- Mute
- Subscribe to RSS Feed
- Permalink
- Report Inappropriate Content
Dimensions
hi,
i have 3 fields, Account, Revenue and Expenditure
I want to show the graph btw Account and Revenue provided that the graph contains only top 10 accounts based on sum(Expenditure)
Thanks
- Tags:
- new_to_qlikview
528 Views
3 Replies
Not applicable
2015-04-15
04:48 AM
Author
- Mark as New
- Bookmark
- Subscribe
- Mute
- Subscribe to RSS Feed
- Permalink
- Report Inappropriate Content
so wat i need is a dimension of top accounts based on sum of expenditure.
how do i do that?
508 Views

 robert_mika
MVP
2015-04-15
04:51 AM
- Mark as New
- Bookmark
- Subscribe
- Mute
- Subscribe to RSS Feed
- Permalink
- Report Inappropriate Content
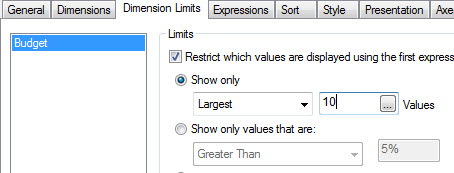
You can limit the number of bars on your chart:
508 Views
robert_mika
MVP
2015-04-15
04:51 AM
- Mark as New
- Bookmark
- Subscribe
- Mute
- Subscribe to RSS Feed
- Permalink
- Report Inappropriate Content
Attached your data/app
508 Views