Unlock a world of possibilities! Login now and discover the exclusive benefits awaiting you.

- Qlik Community
- :
- All Forums
- :
- QlikView
- :
- Display 2 calculated dimension on x-axis
Options
- Subscribe to RSS Feed
- Mark Topic as New
- Mark Topic as Read
- Float this Topic for Current User
- Bookmark
- Subscribe
- Mute
- Printer Friendly Page
Turn on suggestions
Auto-suggest helps you quickly narrow down your search results by suggesting possible matches as you type.
Showing results for

Not applicable
2015-07-08
07:52 AM
- Mark as New
- Bookmark
- Subscribe
- Mute
- Subscribe to RSS Feed
- Permalink
- Report Inappropriate Content
Display 2 calculated dimension on x-axis
Hi,
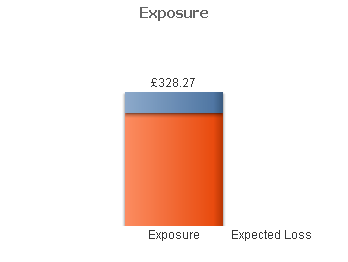
I have a graph with 2 calculated dimensions (Exposure and Expected Loss), and the issue is that Qlikview shows them as a stacked bar. However it shows the legend separately. I want to have two separate bars. How do I do it? Thanks
357 Views
0 Replies