Unlock a world of possibilities! Login now and discover the exclusive benefits awaiting you.

- Qlik Community
- :
- All Forums
- :
- QlikView
- :
- Display Graph if Spike is noticed
- Subscribe to RSS Feed
- Mark Topic as New
- Mark Topic as Read
- Float this Topic for Current User
- Bookmark
- Subscribe
- Mute
- Printer Friendly Page

- Mark as New
- Bookmark
- Subscribe
- Mute
- Subscribe to RSS Feed
- Permalink
- Report Inappropriate Content
Display Graph if Spike is noticed
Hi,
I have built a bar graph which gives me the Usage per country per month.
Most of the times, the usage is average for each month, but if for some reason there is a spike in usage for a country for a particular month compared to other months, only then the graph should display those countries. How can i achieve this?
Ex:
In the below graph that i have, data is displayed for last 4 months and the values are average for one country. As its average usage for all the months, this country should not be displayed.
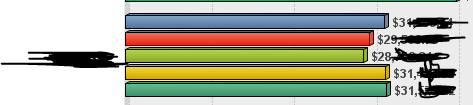
But for another country, there was a major spike in one month, so this should be displayed in the Bar.

How can i achieve this?
I am looking only for those countries which have sudden peaks in usage compared to previous months. Something like if the usage is greater than 30% of the average for a particular month, only then display the graph.
Thanks
Taher
- Mark as New
- Bookmark
- Subscribe
- Mute
- Subscribe to RSS Feed
- Permalink
- Report Inappropriate Content
Hi,
Try Below,
=if(avg({<Year={$(=Max(Year))}>} Usage) >avg({<Year={$(=Max(Year)-1)}>} Usage),avg(Usage))


- Mark as New
- Bookmark
- Subscribe
- Mute
- Subscribe to RSS Feed
- Permalink
- Report Inappropriate Content
May be try this?
If(Sum(usage)>(Sum({<Year={$(=Max(Year))}>} usage) * 0.3), Sum(usage))
- Mark as New
- Bookmark
- Subscribe
- Mute
- Subscribe to RSS Feed
- Permalink
- Report Inappropriate Content
Hi Anil,
I copied the below under expressions in the graph, but didn't notice any difference:
If(Sum(RES_AMOUNT)/1000000>(Sum({<MONTH_YEAR={$(=Max(MONTH_YEAR))}>} RES_AMOUNT/1000000) * 0.3), Sum(RES_AMOUNT)/1000000)
I am suspecting the 'MONTH_YEAR' which holds values as:
APR-2018
MAY-2018
is not working. Any idea what could be wrong?
- Mark as New
- Bookmark
- Subscribe
- Mute
- Subscribe to RSS Feed
- Permalink
- Report Inappropriate Content
Hi Aruna
Hi Anil,
I copied the below under expressions in the graph, but didn't notice any difference:
=if(avg({<MONTH_YEAR={$(=Max(MONTH_YEAR))}>} RES_AMOUNT/1000000) >avg({<MONTH_YEAR={$(=Max(MONTH_YEAR)-1)}>} RES_AMOUNT/1000000),avg(RES_AMOUNT/1000000))
I am suspecting the 'MONTH_YEAR' which holds values as:
APR-2018
MAY-2018
is not working. Any idea what could be wrong?