Unlock a world of possibilities! Login now and discover the exclusive benefits awaiting you.

- Qlik Community
- :
- All Forums
- :
- QlikView
- :
- Duplicate values in scatterplot are added up inste...
- Subscribe to RSS Feed
- Mark Topic as New
- Mark Topic as Read
- Float this Topic for Current User
- Bookmark
- Subscribe
- Mute
- Printer Friendly Page

 qlikmark1990
- Mark as New
- Bookmark
- Subscribe
- Mute
- Subscribe to RSS Feed
- Permalink
- Report Inappropriate Content
Duplicate values in scatterplot are added up instead of plotted seperately
I am new to QLikView and started to analyse the Iris dataset. I also made some calculations on the dataset and made a table of which the first 30 rows are shown.
| Id | PetalLengthCm | PetalWidthCm | PetalRatio | PetalMultiplied | SepalLengthCm | SepalWidthCm | SepalRatio | SepalMultiplied | Species |
| 1 | 1,4 | 0,2 | 7,00 | 0,28 | 5,1 | 3,5 | 1,46 | 17,85 | Iris-setosa |
| 2 | 1,4 | 0,2 | 7,00 | 0,28 | 4,9 | 3 | 1,63 | 14,7 | Iris-setosa |
| 3 | 1,3 | 0,2 | 6,50 | 0,26 | 4,7 | 3,2 | 1,47 | 15,04 | Iris-setosa |
| 4 | 1,5 | 0,2 | 7,50 | 0,3 | 4,6 | 3,1 | 1,48 | 14,26 | Iris-setosa |
| 5 | 1,4 | 0,2 | 7,00 | 0,28 | 5 | 3,6 | 1,39 | 18 | Iris-setosa |
| 6 | 1,7 | 0,4 | 4,25 | 0,68 | 5,4 | 3,9 | 1,38 | 21,06 | Iris-setosa |
| 7 | 1,4 | 0,3 | 4,67 | 0,42 | 4,6 | 3,4 | 1,35 | 15,64 | Iris-setosa |
| 8 | 1,5 | 0,2 | 7,50 | 0,3 | 5 | 3,4 | 1,47 | 17 | Iris-setosa |
| 9 | 1,4 | 0,2 | 7,00 | 0,28 | 4,4 | 2,9 | 1,52 | 12,76 | Iris-setosa |
| 10 | 1,5 | 0,1 | 15,00 | 0,15 | 4,9 | 3,1 | 1,58 | 15,19 | Iris-setosa |
| 11 | 1,5 | 0,2 | 7,50 | 0,3 | 5,4 | 3,7 | 1,46 | 19,98 | Iris-setosa |
| 12 | 1,6 | 0,2 | 8,00 | 0,32 | 4,8 | 3,4 | 1,41 | 16,32 | Iris-setosa |
| 13 | 1,4 | 0,1 | 14,00 | 0,14 | 4,8 | 3 | 1,60 | 14,4 | Iris-setosa |
| 14 | 1,1 | 0,1 | 11,00 | 0,11 | 4,3 | 3 | 1,43 | 12,9 | Iris-setosa |
| 15 | 1,2 | 0,2 | 6,00 | 0,24 | 5,8 | 4 | 1,45 | 23,2 | Iris-setosa |
| 16 | 1,5 | 0,4 | 3,75 | 0,6 | 5,7 | 4,4 | 1,30 | 25,08 | Iris-setosa |
| 17 | 1,3 | 0,4 | 3,25 | 0,52 | 5,4 | 3,9 | 1,38 | 21,06 | Iris-setosa |
| 18 | 1,4 | 0,3 | 4,67 | 0,42 | 5,1 | 3,5 | 1,46 | 17,85 | Iris-setosa |
| 19 | 1,7 | 0,3 | 5,67 | 0,51 | 5,7 | 3,8 | 1,50 | 21,66 | Iris-setosa |
| 20 | 1,5 | 0,3 | 5,00 | 0,45 | 5,1 | 3,8 | 1,34 | 19,38 | Iris-setosa |
| 21 | 1,7 | 0,2 | 8,50 | 0,34 | 5,4 | 3,4 | 1,59 | 18,36 | Iris-setosa |
| 22 | 1,5 | 0,4 | 3,75 | 0,6 | 5,1 | 3,7 | 1,38 | 18,87 | Iris-setosa |
| 23 | 1 | 0,2 | 5,00 | 0,2 | 4,6 | 3,6 | 1,28 | 16,56 | Iris-setosa |
| 24 | 1,7 | 0,5 | 3,40 | 0,85 | 5,1 | 3,3 | 1,55 | 16,83 | Iris-setosa |
| 25 | 1,9 | 0,2 | 9,50 | 0,38 | 4,8 | 3,4 | 1,41 | 16,32 | Iris-setosa |
| 26 | 1,6 | 0,2 | 8,00 | 0,32 | 5 | 3 | 1,67 | 15 | Iris-setosa |
| 27 | 1,6 | 0,4 | 4,00 | 0,64 | 5 | 3,4 | 1,47 | 17 | Iris-setosa |
| 28 | 1,5 | 0,2 | 7,50 | 0,3 | 5,2 | 3,5 | 1,49 | 18,2 | Iris-setosa |
| 29 | 1,4 | 0,2 | 7,00 | 0,28 | 5,2 | 3,4 | 1,53 | 17,68 | Iris-setosa |
I made a scatterplot of PetalRatio against SepalRatio and my problem is that double values are added up and plotted incorrectly.
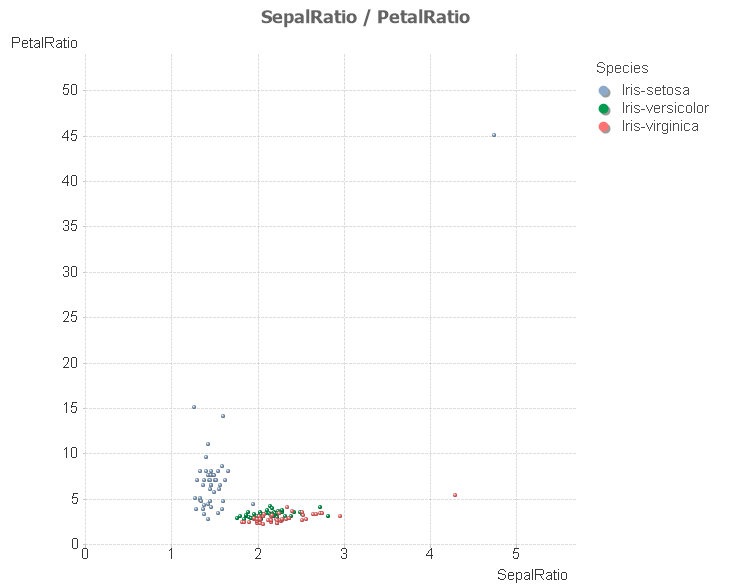
So when I select the value that's located at x = 4,7 and y = 45 I get this table :
| Id | PetalLengthCm | PetalWidthCm | PetalRatio | PetalMultiplied | SepalLengthCm | SepalWidthCm | SepalRatio | SepalMultiplied | Species |
| 10 | 1,5 | 0,1 | 15,00 | 0,15 | 4,9 | 3,1 | 1,58 | 15,19 | Iris-setosa |
| 35 | 1,5 | 0,1 | 15,00 | 0,15 | 4,9 | 3,1 | 1,58 | 15,19 | Iris-setosa |
| 38 | 1,5 | 0,1 | 15,00 | 0,15 | 4,9 | 3,1 | 1,58 | 15,19 | Iris-setosa \ |
The correct values to plot are x = 1,58 and y = 15,00 but they are plotted at a three as higher value. This only happen if a value is not unique as shown in the table above.
How can a plot this 3 values correctly?
 arvind_patil
- Mark as New
- Bookmark
- Subscribe
- Mute
- Subscribe to RSS Feed
- Permalink
- Report Inappropriate Content
Hi Mark,
Add Distinct Keyword In your load Script hence you will get unique values.
Load Distinct
Field1,
.
.
From<Path>
Thanks,
Arvind Patil
qlikmark1990
- Mark as New
- Bookmark
- Subscribe
- Mute
- Subscribe to RSS Feed
- Permalink
- Report Inappropriate Content
Thank you for your answer. Unfortunately it doesn't change anything (I reloaded the script). The script that I currently have is:
SET ThousandSep='.';
SET DecimalSep=',';
SET MoneyThousandSep='.';
SET MoneyDecimalSep=',';
SET MoneyFormat='€ #.##0,00;€ -#.##0,00';
SET TimeFormat='hh:mm:ss';
SET DateFormat='D-M-YYYY';
SET TimestampFormat='D-M-YYYY hh:mm:ss[.fff]';
SET FirstWeekDay=0;
SET BrokenWeeks=0;
SET ReferenceDay=4;
SET FirstMonthOfYear=1;
SET CollationLocale='nl-NL';
SET MonthNames='jan;feb;mrt;apr;mei;jun;jul;aug;sep;okt;nov;dec';
SET LongMonthNames='januari;februari;maart;april;mei;juni;juli;augustus;september;oktober;november;december';
SET DayNames='ma;di;wo;do;vr;za;zo';
SET LongDayNames='maandag;dinsdag;woensdag;donderdag;vrijdag;zaterdag;zondag';
LOAD Distinct Id, SepalLengthCm, SepalWidthCm, PetalLengthCm, PetalWidthCm,
SepalLengthCm / SepalWidthCm as SepalRatio, PetalLengthCm / PetalWidthCm as PetalRatio,
SepalLengthCm * SepalWidthCm as SepalMultiplied, PetalLengthCm * PetalWidthCm as PetalMultiplied, SpecieId
FROM
(ooxml, embedded labels);
Directory;
LOAD Distinct SpecieId, Species
FROM [Iris species.xlsx] (ooxml, embedded labels, table is Iris);
