Unlock a world of possibilities! Login now and discover the exclusive benefits awaiting you.
Announcements
Now accepting applications for the Qlik Luminary and Partner Ambassador Programs: Apply by July 6!
- Qlik Community
- :
- All Forums
- :
- QlikView
- :
- Dynamic Chart
Options
- Subscribe to RSS Feed
- Mark Topic as New
- Mark Topic as Read
- Float this Topic for Current User
- Bookmark
- Subscribe
- Mute
- Printer Friendly Page
Turn on suggestions
Auto-suggest helps you quickly narrow down your search results by suggesting possible matches as you type.
Showing results for
Anonymous
Not applicable
2018-03-28
08:51 AM
- Mark as New
- Bookmark
- Subscribe
- Mute
- Subscribe to RSS Feed
- Permalink
- Report Inappropriate Content
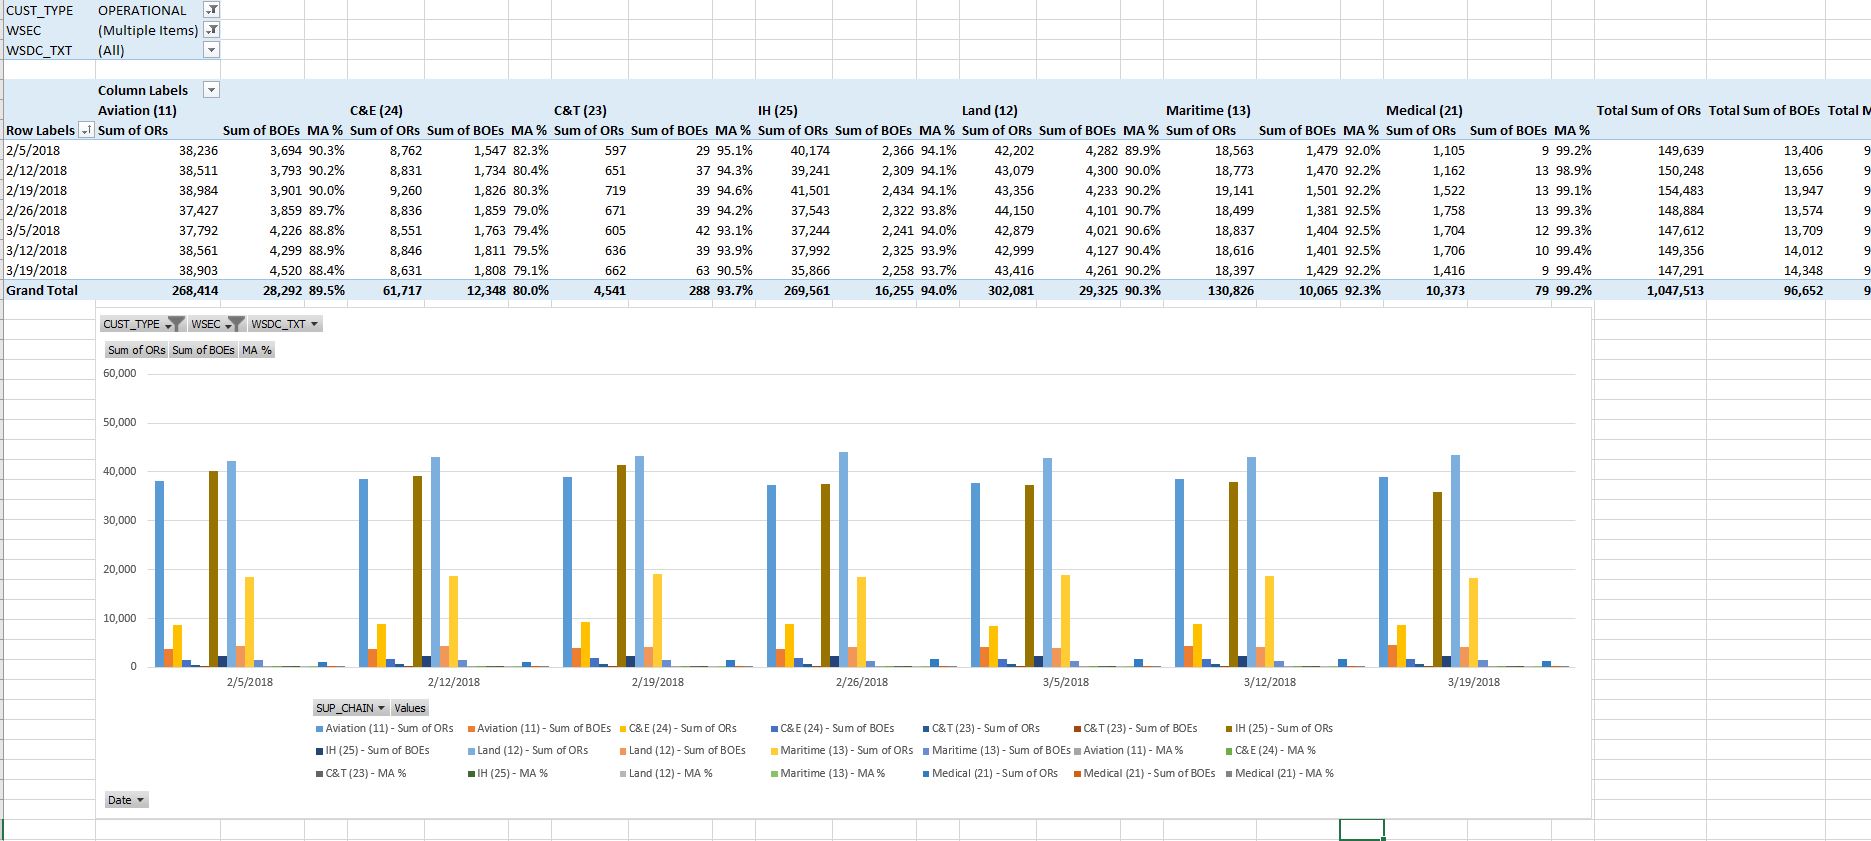
Dynamic Chart
I need help starting a dynamic chart with data that reacts to the data being filtered. Basically like a Pivot Chart in Exel that is based off of a Pivot Table. I would like to create this view and update the data weekly while retaining the history. I attached an example. I would need MA% added as a line chart on the secondary axis.
Thank You!
336 Views
0 Replies