Unlock a world of possibilities! Login now and discover the exclusive benefits awaiting you.
- Qlik Community
- :
- All Forums
- :
- QlikView
- :
- Each Grade wise 100%
- Subscribe to RSS Feed
- Mark Topic as New
- Mark Topic as Read
- Float this Topic for Current User
- Bookmark
- Subscribe
- Mute
- Printer Friendly Page
- Mark as New
- Bookmark
- Subscribe
- Mute
- Subscribe to RSS Feed
- Permalink
- Report Inappropriate Content
Each Grade wise 100%
Hi All,
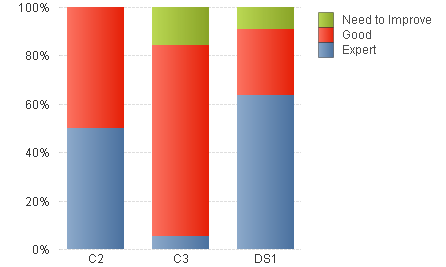
In the below chart I am using Grade,Remarks are Dimensionsand Count(Empid) is a Expression. Can we show each grade wise 100%.
Like B1 wise 100% A2 wise 100%.

Regards
Sharath
- Mark as New
- Bookmark
- Subscribe
- Mute
- Subscribe to RSS Feed
- Permalink
- Report Inappropriate Content
Its hard to help you with only a screen shot. You need to add some total<> clauses to your expression, but without knowing the expressions, dimensions and data model, its just guessing.
- Mark as New
- Bookmark
- Subscribe
- Mute
- Subscribe to RSS Feed
- Permalink
- Report Inappropriate Content
Hi Jonathan,
The below data is i used in My chart
Dimension1:Grade
Dimension2:
If([Remarks] >= 10 And [Remarks] <= 50, 'Need to Improve',
If([Remarks] >50 And [Remarks] <= 80, 'Good', 'Expert')) ---Remarks Status
Expression:count( Employee Id)
Tab1:
LOAD * INLINE [
Employee Id, Grade, Remarks
1189, C3, 76.8
1189, C3, 47.4
1189, C3, 35.3333
2853, C2, 51.3333
3532, C3, 55.6
3532, C3, 68
3532, C3, 70
3751, C3, 78.8
3751, C3, 76.6667
3823, DS1, 0
3823, DS1, 0
3823, DS1, 38.5
3955, C2, 80.8
3955, C2, 60
3955, C2, 56.6667
4004, DS1,
4161, C3, 61.3333
4167, C3, 51.9231
4167, C3, 60.8696
4167, C3, 64.2857
4297, C3, 68
4297, C3, 67.2
4297, C3, 50
4448, DS1, 84.2308
4448, DS1, 65.4167
4677, DS1, 54.2857
4677, DS1, 53.3333
4683, C3, 68.5714
4683, C3, 6.66667
4690, C2, 87.8
4690, C2, 78.8
4690, C2, 83.3333
4690, C2, 87.8
4690, C2, 78.8
4690, C2, 83.3333
4720, DS1,
4778, C3, 52.6667
4778, C3, 52.6667
4802, DS1, 0
4802, DS1, 0
];
- Mark as New
- Bookmark
- Subscribe
- Mute
- Subscribe to RSS Feed
- Permalink
- Report Inappropriate Content
You want it like this?
Then use this as the expression:
Count([Employee Id])/Count(TOTAL <Grade> [Employee Id])
(and turn off the Relative option on Properties | Expressions)
- Mark as New
- Bookmark
- Subscribe
- Mute
- Subscribe to RSS Feed
- Permalink
- Report Inappropriate Content
I would also create Dimension 2 in script, like this:
Tab1:
LOAD
[Employee Id],
Grade,
Remarks,
If([Remarks] >= 10 And [Remarks] <= 50, 'Need to Improve',
If([Remarks] >50 And [Remarks] <= 80, 'Good', 'Expert')) As Dim2
INLINE [
Employee Id, Grade, Remarks
1189, C3, 76.8
1189, C3, 47.4
1189, C3, 35.3333
2853, C2, 51.3333
3532, C3, 55.6
....
- Mark as New
- Bookmark
- Subscribe
- Mute
- Subscribe to RSS Feed
- Permalink
- Report Inappropriate Content
No Jonathan.The above Chart is displaying 100% for C2,C3,DS1. But i want to C2 wise 100% and C3 wise 100% like this.......C2---32% Expert
48% Good
20% Need to Improve
- Mark as New
- Bookmark
- Subscribe
- Mute
- Subscribe to RSS Feed
- Permalink
- Report Inappropriate Content
Change the order of your dimension. Move Grade up and Remarks down and then change your expression to this:
Count([Employee Id])/Count(TOTAL <Remarks> [Employee Id])
- Mark as New
- Bookmark
- Subscribe
- Mute
- Subscribe to RSS Feed
- Permalink
- Report Inappropriate Content
This is what you are looking for?
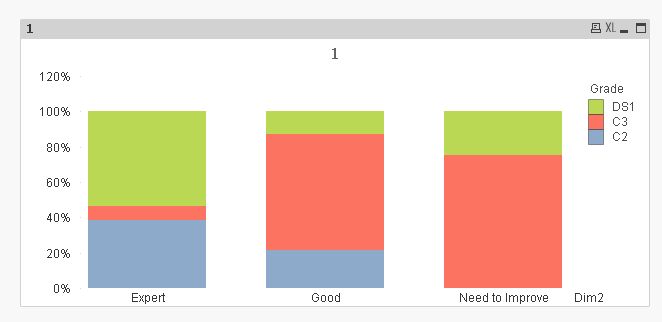
Used Jonathan's script
Dimension1: Dim2
Dimension2: Grade
Expression: =Count([Employee Id])/Count(TOTAL <Dim2> [Employee Id])
- Mark as New
- Bookmark
- Subscribe
- Mute
- Subscribe to RSS Feed
- Permalink
- Report Inappropriate Content
No Jonathan.The above Chart is displaying 100% for C2,C3,DS1. But i want to C2 wise 100% and C3 wise 100% like this.......C2---32% Expert
48% Good
20% Need to Improve
Is that not what I have given you? Each grade, like C2, adds up to 100%.