Unlock a world of possibilities! Login now and discover the exclusive benefits awaiting you.
- Qlik Community
- :
- All Forums
- :
- QlikView
- :
- Expression col outside of group
- Subscribe to RSS Feed
- Mark Topic as New
- Mark Topic as Read
- Float this Topic for Current User
- Bookmark
- Subscribe
- Mute
- Printer Friendly Page
- Mark as New
- Bookmark
- Subscribe
- Mute
- Subscribe to RSS Feed
- Permalink
- Report Inappropriate Content
Expression col outside of group
Hi All,
struggling to achive some functionality. Looks like below.
Group Dimension -------------------------------------------------->
Dimension 1 ¦ Dimension 2 ¦ Col Expression1 ¦ Col Expression2 ¦ Col Expression2 ¦ Col Expression2
So basically, i dont want Col expression1 to be grouped. Possible?
- Tags:
- new_to_qlikview
Accepted Solutions
- Mark as New
- Bookmark
- Subscribe
- Mute
- Subscribe to RSS Feed
- Permalink
- Report Inappropriate Content
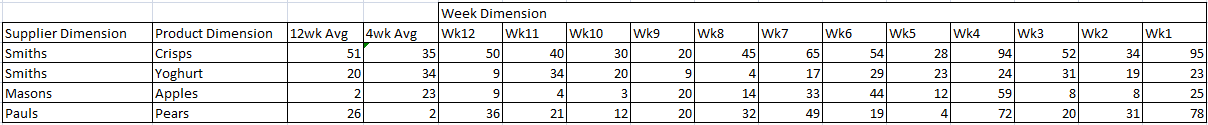
Ok, you can try using two calculated dimensions for the 12wk Avg and 4wk Avg columns. If you have a Date field then those expressions would look something like this:
aggr(avg({<Date={'>$(=max(Date)-84)<=$(=max(Date))'}>}Value),Supplier,Product)
aggr(avg({<Date={'>$(=max(Date)-28)<=$(=max(Date))'}>}Value),Supplier,Product)
talk is cheap, supply exceeds demand
- Mark as New
- Bookmark
- Subscribe
- Mute
- Subscribe to RSS Feed
- Permalink
- Report Inappropriate Content
May be you can use Col Expression 1 as a Calculated Dimension with Aggr in Pivot Table.
But without looking your sample file or application, difficult to give an accurate reply.
- Mark as New
- Bookmark
- Subscribe
- Mute
- Subscribe to RSS Feed
- Permalink
- Report Inappropriate Content
I'm afraid I don't understand what you're trying to do. Can you give an example? Perhaps a mockup of the result in an excel file?
talk is cheap, supply exceeds demand
- Mark as New
- Bookmark
- Subscribe
- Mute
- Subscribe to RSS Feed
- Permalink
- Report Inappropriate Content
sure, the expressions are averages based on a dynamic date range, The grouping effectively provides the detail.
- Mark as New
- Bookmark
- Subscribe
- Mute
- Subscribe to RSS Feed
- Permalink
- Report Inappropriate Content
Ok, you can try using two calculated dimensions for the 12wk Avg and 4wk Avg columns. If you have a Date field then those expressions would look something like this:
aggr(avg({<Date={'>$(=max(Date)-84)<=$(=max(Date))'}>}Value),Supplier,Product)
aggr(avg({<Date={'>$(=max(Date)-28)<=$(=max(Date))'}>}Value),Supplier,Product)
talk is cheap, supply exceeds demand
- Mark as New
- Bookmark
- Subscribe
- Mute
- Subscribe to RSS Feed
- Permalink
- Report Inappropriate Content
Perfect! Thank you Gysbert!