Unlock a world of possibilities! Login now and discover the exclusive benefits awaiting you.

- Qlik Community
- :
- All Forums
- :
- QlikView
- :
- Expression reuse
- Subscribe to RSS Feed
- Mark Topic as New
- Mark Topic as Read
- Float this Topic for Current User
- Bookmark
- Subscribe
- Mute
- Printer Friendly Page

 ali_hijazi
- Mark as New
- Bookmark
- Subscribe
- Mute
- Subscribe to RSS Feed
- Permalink
- Report Inappropriate Content
Expression reuse
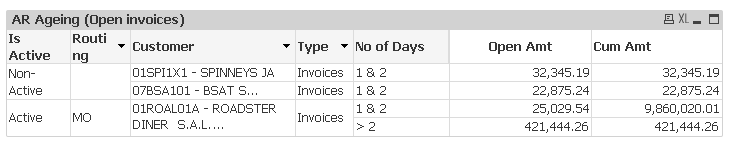
Hello Got a pivot table showing AR Ageing (check attached) document
in the copy that I've attached I have the Invoice Number 84035 with amount 421,444.26 and No. of Days =3
then I got the remaining invoices with number of days = 2 and 1
What I want now is to create a new pivot table showing for each customer the amount of invoices whose ageing days is between 1, and 2
and those whose ageing is >2
i.e. the pivot table shows customer name, then expression 1 sum(amount) where ageing is between 1,and 2 and a second expression showing the amount where ageing is >2
i.e. for the available customer show:
421,444.26
and on the second column show
| 25029.54 |
of course by reusing the expression used to calculate ageing
Please advise
- Tags:
- sunny t
- « Previous Replies
-
- 1
- 2
- Next Replies »

 sunny_talwar
- Mark as New
- Bookmark
- Subscribe
- Mute
- Subscribe to RSS Feed
- Permalink
- Report Inappropriate Content
Is this what you want?
ali_hijazi
- Mark as New
- Bookmark
- Subscribe
- Mute
- Subscribe to RSS Feed
- Permalink
- Report Inappropriate Content
you didn't attach the solution
sunny_talwar
- Mark as New
- Bookmark
- Subscribe
- Mute
- Subscribe to RSS Feed
- Permalink
- Report Inappropriate Content
I have attached the qvw file above

 vinieme12
- Mark as New
- Bookmark
- Subscribe
- Mute
- Subscribe to RSS Feed
- Permalink
- Report Inappropriate Content
instead of Creating new tables , why not re-use the same table and add a Listbox for the user to filter on?
Create an expression listbox for users to filter on
=AGGR(
$(vCustomerAgeing_OpenInvoice_Days)
,InvoiceNum)
If a post helps to resolve your issue, please accept it as a Solution.
ali_hijazi
- Mark as New
- Bookmark
- Subscribe
- Mute
- Subscribe to RSS Feed
- Permalink
- Report Inappropriate Content
I don't want this as dimension
I want to create separate expressions
in fact on the real dashboard I want to have the classification as columns:
31-60 61-90 91-120 >120
or something like this
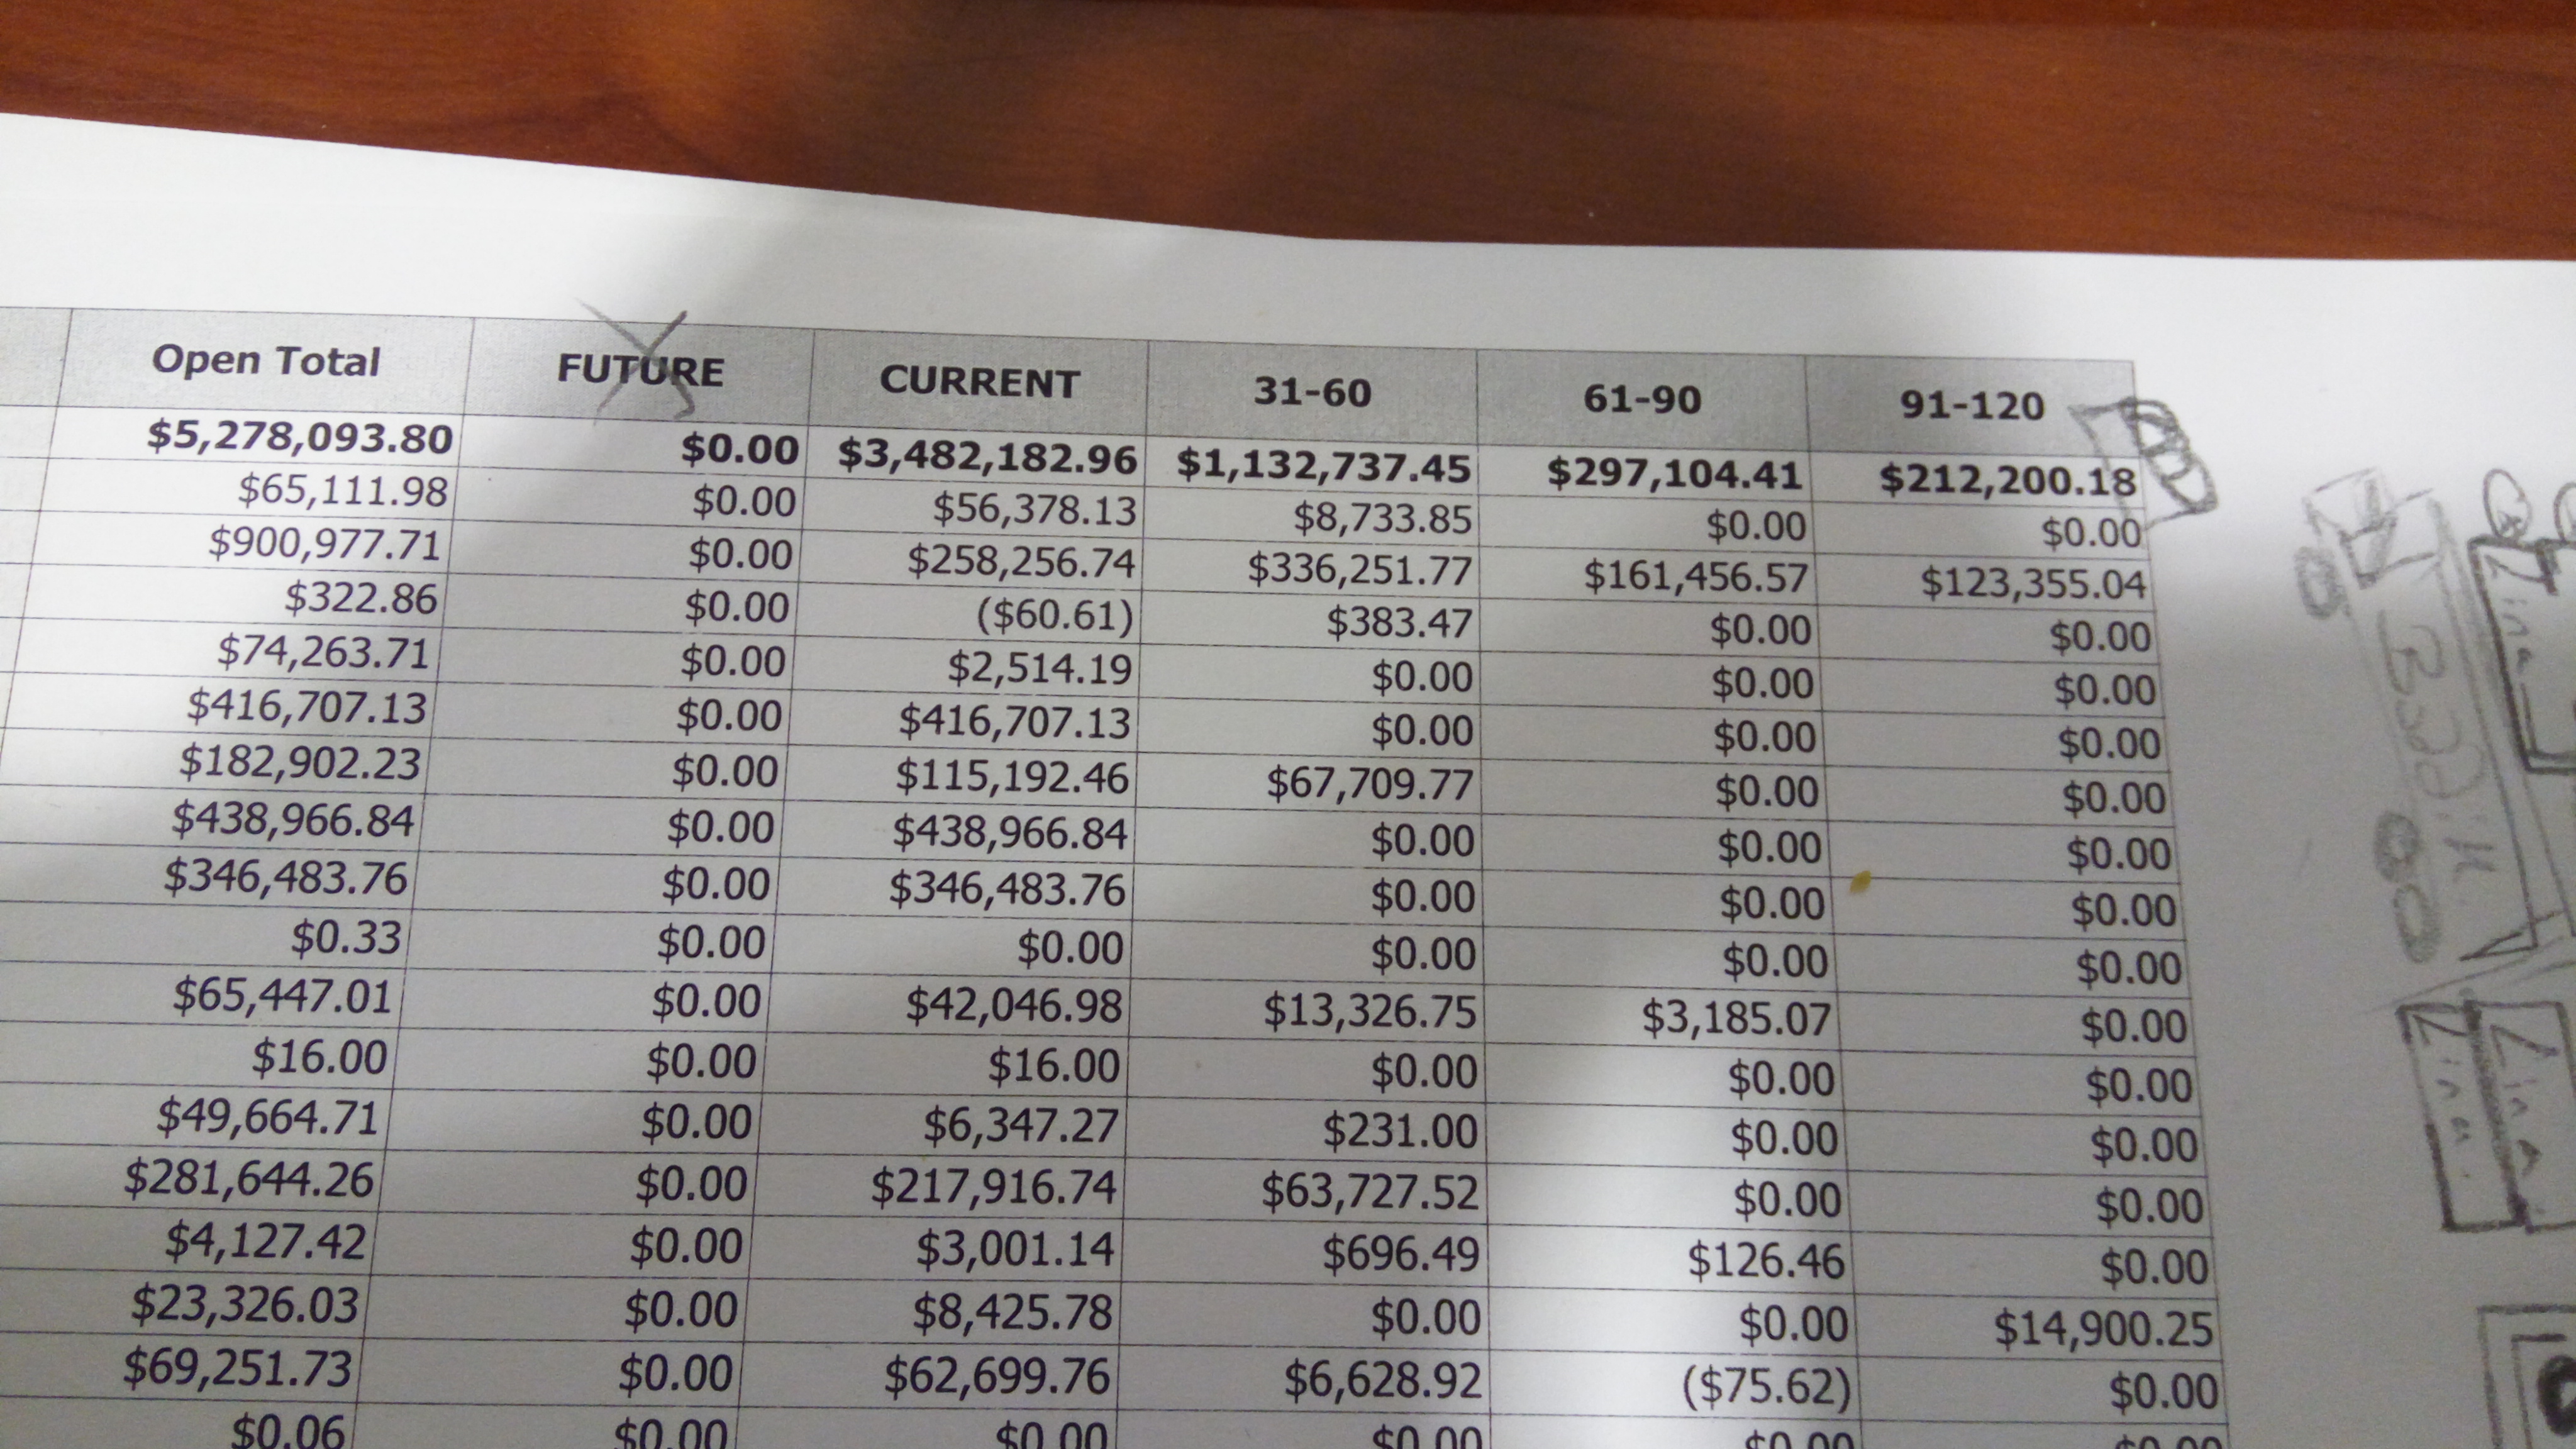
I asked for 1&2 and >2 to match the available data in the copy I shared with you
ali_hijazi
- Mark as New
- Bookmark
- Subscribe
- Mute
- Subscribe to RSS Feed
- Permalink
- Report Inappropriate Content
I want to have pre-defined brackets
<= 30 31-60 61-90 91-120 >120
vinieme12
- Mark as New
- Bookmark
- Subscribe
- Mute
- Subscribe to RSS Feed
- Permalink
- Report Inappropriate Content
try Expression listbox as
= replace(AGGR(class($(vCustomerAgeing_OpenInvoice_Days),30),InvoiceNum),'<= x <',' - ')
If a post helps to resolve your issue, please accept it as a Solution.
ali_hijazi
- Mark as New
- Bookmark
- Subscribe
- Mute
- Subscribe to RSS Feed
- Permalink
- Report Inappropriate Content
and additional expressions may be added to the chart other than these required right now
vinieme12
- Mark as New
- Bookmark
- Subscribe
- Mute
- Subscribe to RSS Feed
- Permalink
- Report Inappropriate Content
UPDATED EXPRESSION
= replace(AGGR(if($(vCustomerAgeing_OpenInvoice_Days)>120,'>120',class($(vCustomerAgeing_OpenInvoice_Days),30)),InvoiceNum),'<= x <',' - ')
If a post helps to resolve your issue, please accept it as a Solution.

- « Previous Replies
-
- 1
- 2
- Next Replies »