Unlock a world of possibilities! Login now and discover the exclusive benefits awaiting you.

- Qlik Community
- :
- All Forums
- :
- QlikView
- :
- Re: Find difference between 2 values across a cert...
Options
- Subscribe to RSS Feed
- Mark Topic as New
- Mark Topic as Read
- Float this Topic for Current User
- Bookmark
- Subscribe
- Mute
- Printer Friendly Page
Turn on suggestions
Auto-suggest helps you quickly narrow down your search results by suggesting possible matches as you type.
Showing results for

 NewbieToQV
Contributor II
2024-01-18
06:42 AM
- Mark as New
- Bookmark
- Subscribe
- Mute
- Subscribe to RSS Feed
- Permalink
- Report Inappropriate Content
Find difference between 2 values across a certain date range
Hi, I need help on the below.
I have grades of some students and need to know if they improved on the results based on the latest 2 tests. (i.e. I need the result tab in yellow).

I am on QlikView and appreciate your assistance. Many thanks.
3 Replies

 rwunderlich
MVP
2024-01-18
03:32 PM
- Mark as New
- Bookmark
- Subscribe
- Mute
- Subscribe to RSS Feed
- Permalink
- Report Inappropriate Content
What does you data table look like when loaded into QV? Can you post a screenshot of the table model?
-Rob
1,536 Views

2024-01-18
09:44 PM
- Mark as New
- Bookmark
- Subscribe
- Mute
- Subscribe to RSS Feed
- Permalink
- Report Inappropriate Content
Try something like this,
tab1:
CrossTable(Month, Grade)
LOAD * INLINE [
    ID, 1/1/23, 2/1/23, 3/1/23, 4/1/23, 5/1/23, 6/1/23, 7/1/23, 8/1/23
    1000, , , A, B, Pass, , ,
    1001, , , , , , , D,
    1002, , , , , , D, , A
    1003, A, B, B, , , , ,
];

Left Join(tab1)
LOAD ID, Concat(If(Not Len(Trim(Grade))=0,Grade&'@'),'',Date#(Month)) As C1
Resident tab1
Group By ID;

Left Join(tab1)
LOAD ID, SubField(C1,'@',-3) &'->'& SubField(C1,'@',-2) As Rationale,
	If(SubField(C1,'@',-2) > If(SubField(C1,'@',-3)='Pass','Z',SubField(C1,'@',-3)), 'Deteriorate',
		If(SubField(C1,'@',-2) < SubField(C1,'@',-3), 'Improve',
			'n/a')) As Result
Resident tab1;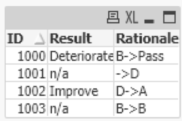
1,524 Views
NewbieToQV
Contributor II
2024-01-18
11:26 PM
Author
- Mark as New
- Bookmark
- Subscribe
- Mute
- Subscribe to RSS Feed
- Permalink
- Report Inappropriate Content
Thanks!
I don't have access to the script. Any solution to do at the chart/table properties?
1,517 Views
