Unlock a world of possibilities! Login now and discover the exclusive benefits awaiting you.

- Qlik Community
- :
- All Forums
- :
- QlikView
- :
- Fixed bubble chart
- Subscribe to RSS Feed
- Mark Topic as New
- Mark Topic as Read
- Float this Topic for Current User
- Bookmark
- Subscribe
- Mute
- Printer Friendly Page

 Pedro_Rodriguez
- Mark as New
- Bookmark
- Subscribe
- Mute
- Subscribe to RSS Feed
- Permalink
- Report Inappropriate Content
Fixed bubble chart
Hello everybody,
I'm trying to create something like this:
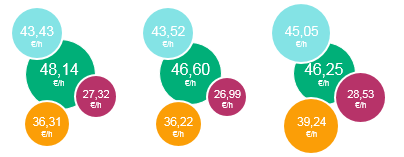
Each of the 3 belong to a different year.
As you can the size of the circles vary depending on the value inside.
Is there any way to build this as a chart or do I have to do it with fixed text boxes?
Thanks a lot in advance!

- Mark as New
- Bookmark
- Subscribe
- Mute
- Subscribe to RSS Feed
- Permalink
- Report Inappropriate Content
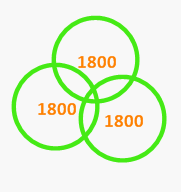
Till how many Years data you have. Assume, here i think we can go two objects .
I would first prefer Gauge chart nor Text objects. I am doubt, Whether text object can handle this or not because we need to increase height and width based on number. Can you check the same
Like this, I am talking about in Gauge chart

 rwunderlich
- Mark as New
- Bookmark
- Subscribe
- Mute
- Subscribe to RSS Feed
- Permalink
- Report Inappropriate Content
I don't mean to be disrespectful, but why do you want to build a chart like this? It seems a very poor representation of data. Are you stuck with someone saying "it has to look this" or do the have the possibility of re-imagining a more effective way to show the data?
-Rob
Pedro_Rodriguez
- Mark as New
- Bookmark
- Subscribe
- Mute
- Subscribe to RSS Feed
- Permalink
- Report Inappropriate Content
@ROb Wunderlich I'm affraid it has to be like this, it's a .ppt model that I have to reproduce in QV.
@Anil Babu Samineni It's 3 years data, but it changes, it's the present year plus the 2 previous ones.
If you can achieve something similar it would be nice. With text object would be possible but it´s the problem of the variable size.
Thanks
