Unlock a world of possibilities! Login now and discover the exclusive benefits awaiting you.

- Qlik Community
- :
- All Forums
- :
- QlikView
- :
- Re: Fractile - QlikView
- Subscribe to RSS Feed
- Mark Topic as New
- Mark Topic as Read
- Float this Topic for Current User
- Bookmark
- Subscribe
- Mute
- Printer Friendly Page

 satishkurra
- Mark as New
- Bookmark
- Subscribe
- Mute
- Subscribe to RSS Feed
- Permalink
- Report Inappropriate Content
Fractile - QlikView
Hi
I'm facing issue in displaying the chart for < 95 percentile values.
Attached is the data, i have for Record Id, Revenue. Gross Margin % is a calculated field in the expression (Gross Margin/Fee Revenue)
I also have expressions for Revenue and Gross Margin % as
Revenue:
Sum({<FiscalYear={'$(vMaxYear)'},Date={'<=$(vMaxDate1)'}, Fiscal_Month=>}[Revenue])
Gross Margin %:
Avg({<FiscalYear={'$(vMaxYear)'},Date={'<=$(vMaxDate1)'}, Fiscal_Month=>}[Gross Margin])
/
Avg({<FiscalYear={'$(vMaxYear)'},Date={'<=$(vMaxDate1)'}, Fiscal_Month=>}[Fee Revenue])
I need to display the chart only for < 95 percentile values.
Can someone help me on the same.
- « Previous Replies
-
- 1
- 2
- Next Replies »
satishkurra
- Mark as New
- Bookmark
- Subscribe
- Mute
- Subscribe to RSS Feed
- Permalink
- Report Inappropriate Content
Hi Sunny
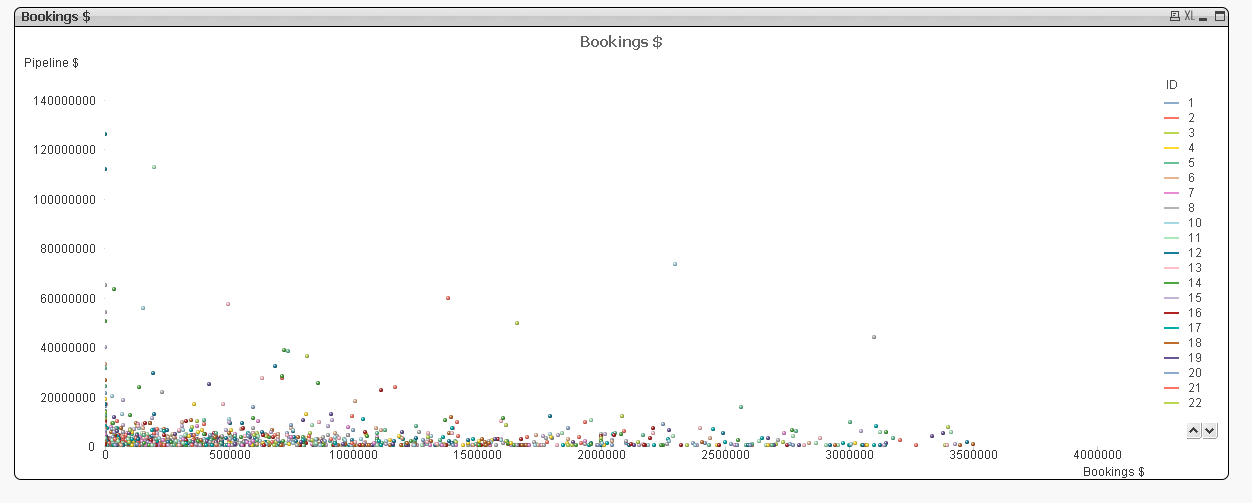
I see scatter plot too.
All the bubbles are at the same position.
Is there a way to include values in chart with only < 95th percentile values?
Thanks
Satish

 sunny_talwar
- Mark as New
- Bookmark
- Subscribe
- Mute
- Subscribe to RSS Feed
- Permalink
- Report Inappropriate Content
Same position?
satishkurra
- Mark as New
- Bookmark
- Subscribe
- Mute
- Subscribe to RSS Feed
- Permalink
- Report Inappropriate Content
I mean close to Zero. If we get the values of 95th percentile, may be we get better distribution across the chart?
sunny_talwar
- Mark as New
- Bookmark
- Subscribe
- Mute
- Subscribe to RSS Feed
- Permalink
- Report Inappropriate Content
Assuming you want below 95% by Bookings $... try these two expression
Sum({<ID = {"=Sum([Bookings $]) <= Fractile(TOTAL Aggr(Sum([Bookings $]), ID), 0.95)"}>}[Bookings $])
Sum({<ID = {"=Sum([Bookings $]) <= Fractile(TOTAL Aggr(Sum([Bookings $]), ID), 0.95)"}>}[Pipeline $])
satishkurra
- Mark as New
- Bookmark
- Subscribe
- Mute
- Subscribe to RSS Feed
- Permalink
- Report Inappropriate Content
Thanks Sunny.

- « Previous Replies
-
- 1
- 2
- Next Replies »